
FIG. 2.
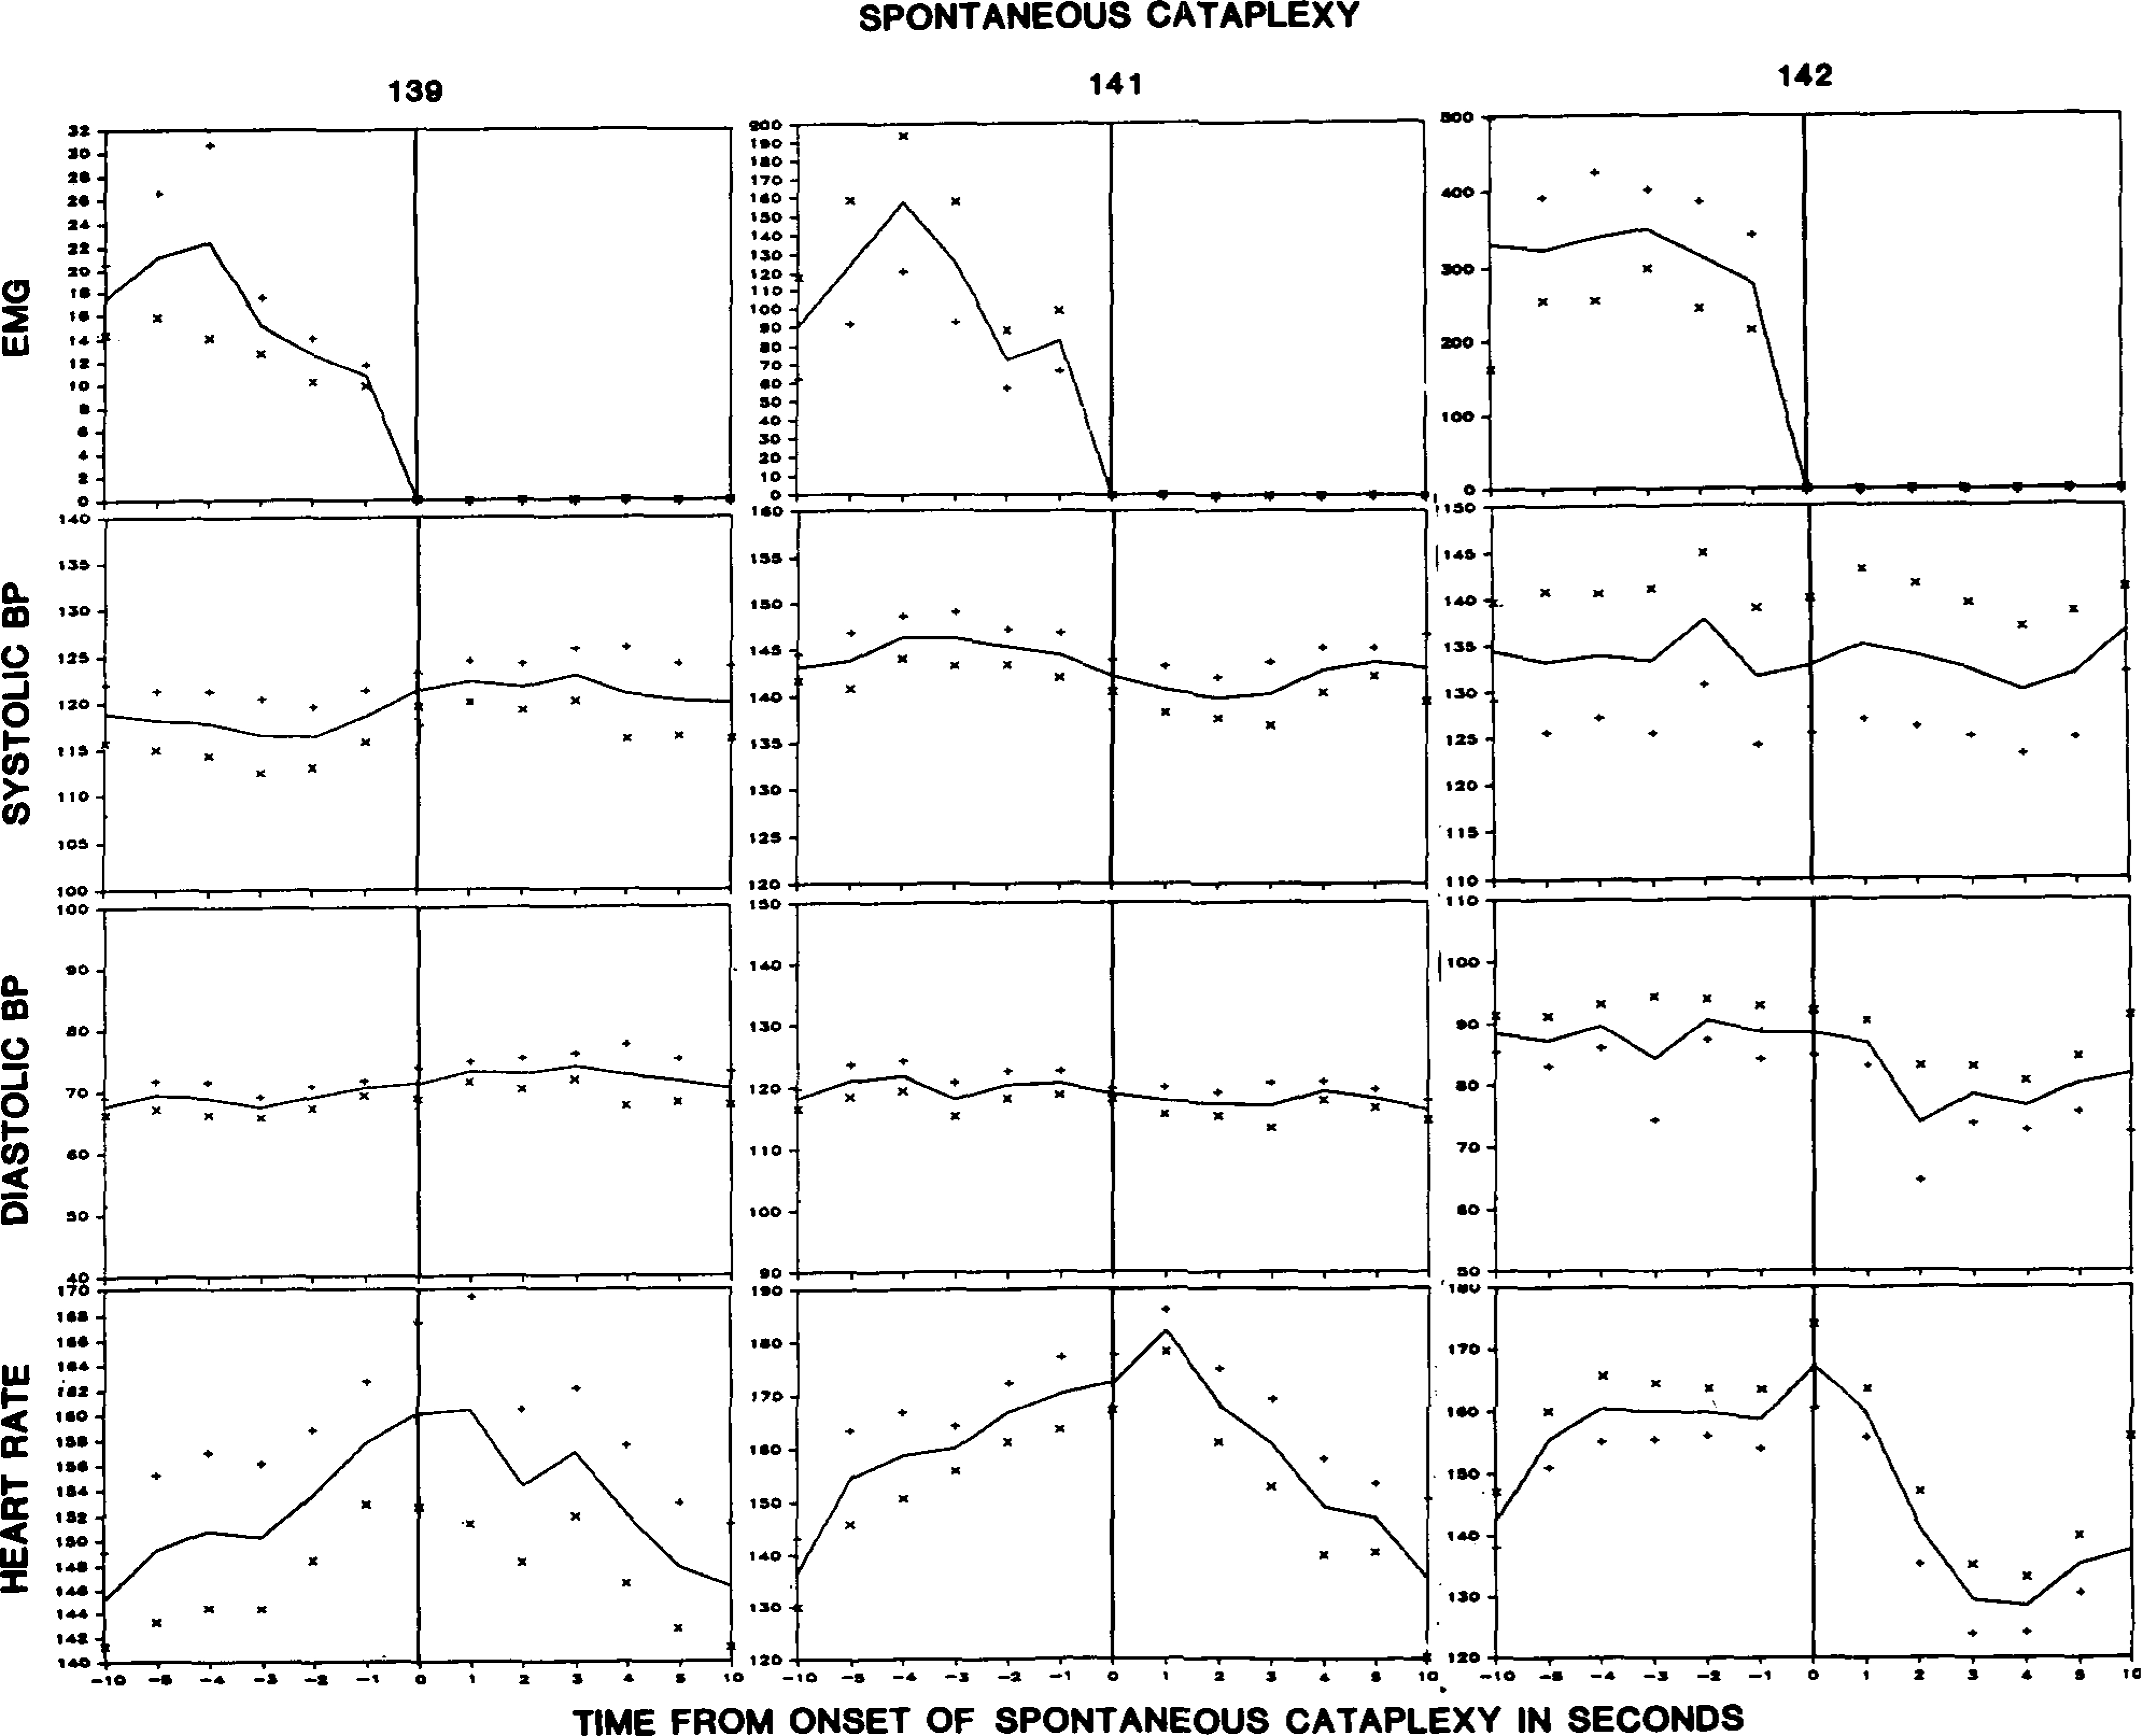
Averaged electromyogram (EMG), blood pressure (BP), and heart rate changes during the period beginning 10 s prior to cataplexy onset and ending 10 s after cataplexy onset. Graphs are based on 10 cataplectic episodes in dogs #141 and 142 and on 7 episodes in dog #139. + and × signs indicate standard error.