

ABSTRACT
Emerging evidence supports that exposure to persistent organic pollutants (POPs) can impact the interaction between the gut microbiota and host. Recent efforts have characterized the relationship between gut microbiota and environment pollutants suggesting additional research is needed to understand potential new avenues for toxicity. Here, we systematically examined the direct effects of POPs including 2,3,7,8-tetrachlorodibenzofuran (TCDF), 2,3,7,8-tetrachlorodibenzo-p-dioxin (TCDD), and polychlorinated biphenyls (PCB-123 and PCB-156) on the microbiota using metatranscriptomics and NMR- and mass spectrometry-based metabolomics combined with flow cytometry and growth rate measurements (OD600). This study demonstrated that (1) POPs directly and rapidly affect isolated cecal bacterial global metabolism that is associated with significant decreases in microbial metabolic activity; (2) significant changes in cecal bacterial gene expression related to tricarboxylic acid (TCA) cycle as well as carbon metabolism, carbon fixation, pyruvate metabolism, and protein export were observed following most POP exposure; (3) six individual bacterial species show variation in lipid metabolism in response to POP exposure; and (4) PCB-153 (non-coplanar)has a greater impact on bacteria than PCB-126 (coplanar) at the metabolic and transcriptional levels. These data provide new insights into the direct role of POPs on gut microbiota and begins to establish possible microbial toxicity endpoints which may help to inform risk assessment.
KEYWORDS: Persistent organic pollutants, gut microbiota, metabolomics, metatranscriptomics, NMR, mass spectrometry, flow cytometry, growth rate measurements
Introduction
Persistent organic pollutants (POPs) are a group of organic compounds and represent a global concern due to their environmental persistence (https://www.who.int/foodsafety/areas_work/chemical-risks/pops/en/). POPs have been implicated in human health problems including cancer,1,2 birth defects,3,4 immune system disorders,5 endocrine disruption,6 and reproductive disorder.7 Recently, laboratory studies on animals and human epidemiological studies have identified associations between POP exposure and the potential for increased risk of metabolic disorder, obesity, and/or diabetes.8,9
The gut microbiota are sensitive to diet, drugs, and environmental pollutants.10 Importantly, the toxicologic relevance of the bacteria–xenobiotic interaction for the host needs to be assessed.11 Several environmental chemicals have been reported to interfere with the composition of gut microbiota affecting overall gut microbiome homeostasis.12,13 Pollutants can affect the enzymatic capacities and metabolic activities of the gut microbiota without changing the community composition.12 However, it is still unclear how the gut microbiota and environmental chemicals interact and whether these interactions are relevant for human health.
The gut microbiota exerts important effects on host homeostasis and immune functions.14,15 Alterations of the gut microbiota community and/or functions such as the ability to process and absorb dietary carbohydrates and complex lipids in the host are associated with various health disorders.16,17 A recent review suggested that gut microbiota might affect obesity and diabetes by altering human toxicodynamics including the activation, absorption, disposition, metabolism, and excretion of environmental chemicals.18 Our previous studies have shown that dietary POPs modified gut microbiota-host metabolic homeostasis in mice through modulation of aryl hydrocarbon receptor activity.13,19 Moreover, our lab investigated the functional and structural changes imparted by dietary TCDF to the gut microbiota and host using 16S rRNA gene sequencing, metabolomics, and bacterial metatranscriptomics.20 However, most studies to date have assessed host toxicity, while the direct effect of POPs on the gut microbiota have been explored by relatively few studies. Here, we combined flow cytometry, 16S rRNA gene sequencing, metatranscriptomics, and metabolomics to determine the responses of the gut microbiome to four POPs including TCDF, TCDD, and two PCBs (Figure 1).
Figure 1.

Experimental workflow for determining the direct impact of POPs on bacteria. (a) Scheme for determining the physiologic, metabolic, and transcriptional impact of four POPs on isolated cecal bacteria and individual species. (b) Metatranscriptomics workflow analysis from isolated cecal bacteria with POPs exposure (created with BioRender.com). (c) Chemical structures of four POPs used in this study
Using these complementary techniques, we demonstrate that short-term exposure to POPs not only alters bacterial physiology, but also significantly alters the metabolism of the overall microbial community, in addition to gene expression. Individual bacteria species display marked variation in lipid metabolism in response to POP exposure. Exposure to a non-coplanar POP resulted in a more dramatic metabolic and transcriptional response to bacteria relative to a coplanar POP. Our results provide new insights into the direct impact of POPs on the gut microbiota.
Results
The physiologic and community structure effect of POPs on cecal bacterial mixtures in vitro
Cecal bacterial physiologic status after short-term exposure of POPs in vitro was assessed using a flow cytometry approach (Figure 2). A significant dose-dependent decrease in bacteria with high nucleic acid (HNA) content was observed following exposure to all four POPs (Figure 2(a)). Short-term incubation of POPs resulted in no significant changes in SybrGreen, propidium iodide (Pi), and bis-(1,3-dibutylbarbituric acid) trimethine oxonol (DiBAC4) stained cells but significantly decreased carboxyfluorescein diacetate (CFDA)-stained bacteria in a dose-dependent manner (Figure 2(a-b)), suggesting a rapid decrease in microbial metabolic activity without significant cell damage. Moreover, changes in the cecal community structure were observed with TCDD exposure via Generalized UniFrac analysis (Supplementary Figure 1a). Short-term TCDD exposure had significantly increased numbers of bacteria from the genus Lactobacillus, Roseburia, and Oscillibacter but decrease in the genus Bacteroides (Supplementary Figure 1b).
Figure 2.

The physiological response of isolated cecal bacteria to POPs exposure in vitro. (a) Flow cytometric analyses of proportions of SybrGreen, low nuclei acid (LNA), and HNA-stained cells from isolated cecal bacteria with vehicle or two doses of POPs exposure for 4 h. (b) Flow cytometric analyses of proportions of CFDA, Pi, and DiBAC4-stained cells from isolated cecal bacteria with vehicle or two doses of POPs exposure for 4 h. Values are means ± S.D. (n = 4 per group). * P < .05, ** P < .01, *** P < .001 compare to vehicle
The metabolic effect of POPs on cecal bacterial mixtures in vitro
To further explore the influence of POPs on the cecal bacteria, hydrophilic metabolite and lipid profiling were performed using 1H NMR-based metabolomics (Figure 3). Principal component analysis (PCA) score plots showed distinct clustering of hydrophilic metabolite and lipid profiling obtained from cecal bacteria with two doses of POPs compared to vehicle (Figure 3(a) and 3(c)). PCB 153 exposure (6 µM) resulted in significantly lower levels of nucleic acids, acetate, formate, methionine, and aspartate, but significantly higher levels of glucose, lipids, lactate, butyrate, succinate, alanine, lysine, tyrosine, phenylalanine, and branched-chain amino acids (BCAAs) in cecal bacteria (Figure 3(b)). In contrast, TCDF, TCDD, and PCB 126 did not exhibit a pronounced effect on microbial hydrophilic metabolites (Figure 3(b)). Significant changes in fatty acid metabolism were observed with PCB 153 exposure (6 µM) compared to other POPs (Figure 3(d)). PCB 153 exposure (6 µM) resulted in significantly lower unsaturated fatty acids (UFA) and monounsaturated fatty acids (MUFA) but higher saturated fatty acids (SFA) and the ratio of SFA to UFA; whereas exposure to other POPs resulted in significantly lower SFA but higher UFA and MUFA (Figure 3(d)).
Figure 3.

1H NMR-based metabolomics analysis of isolated cecal bacteria in response to POPs exposure in vitro. (a) PCA score plots obtained from 1H NMR data of hydrophilic metabolite profiling for the isolated cecal bacteria with vehicle or two doses of POPs exposure for 4 h. (b) Heat map representation of relative content of hydrophilic metabolites from isolated cecal bacteria with vehicle or two doses of POPs exposure for 4 h. Red shades represent metabolites that are increased, and blue shades represent metabolites that are decreased. (c) PCA score plots obtained from 1H NMR data of lipid profiling for the isolated cecal bacteria with vehicle or two doses of POPs exposure for 4 h. (d) The relative levels for representative fatty acids from isolated cecal bacteria with vehicle or two doses of POPs exposure for 4 h. (n = 5 per group). * P < .05, ** P < .01, *** P < .001 compare to vehicle
UPLC-MS analysis was performed to identify altered microbial lipids following POP exposure (Figure 4 and Supplementary Table 1–2). Significant increases in bacterial membrane lipids including fatty acid, fatty acid esters of hydroxy fatty acid (FAHFA), phosphatidylcholine (PC), phosphatidylethanolamine (PE), phosphatidylinositol (PI), phosphatidylglycerol (PG), sphingomyelin (SM), diacylg lycerol (DAG), triacylglycerol (TAG), lysophosphati dylcholine (LPC), and lysophosphatidylethanolamine (LPE) were observed following two doses (0.6 µM and 6 µM) of PCB 153 and a higher dose of TCDD (0.6 µM) and PCB 126 (6 µM) exposure (Figure 4(a-b) and Supplementary Table 1–2). Together, these results indicate that short-term incubation of POPs directly and rapidly affect cecal bacterial global metabolism that is associated with significant decreases in microbial metabolic activity.
Figure 4.

UPLC-MS/MS-based metabolomics analysis of lipid profiling from isolated cecal bacteria in response to POPs exposure in vitro. Heat map representation of the abundance of lipids from isolated cecal bacteria with vehicle or two doses of POPs exposure for 4 h from positive (a) and negative (b) modes. Red shades represent metabolites that are increased, and blue shades represent metabolites that are decreased. (n = 4 per group)
The transcriptional effect of POPs on cecal bacterial mixtures in vitro
We investigated the bacterial functional response to POPs by analyzing the metatranscriptome from cecal bacteria with TCDF (6 µM), TCDD (0.6 µM), and PCBs (6 µM) exposure compared to vehicle using RNA-seq. PCA showed distinct separations between cecal bacteria with vehicle and POP exposure with the greatest differences occurring between PCB 153 and other POP (p-value = 0.002 of PCA models from each POP compared to vehicle) (Figure 5(a)). The number of differentially expressed gene orthologs differed among samples exposed to different POPs (Figure 5(b)). The number of upregulated gene orthologs varied from 60 to 212 for TCDD (0.6 µM) and PCB 153 exposure (6 µM), while the number of downregulated gene orthologs varied from 19 to 84 for PCB 126 (6 µM) and TCDD exposure (0.6 µM) (Figure 5(b)). Among the differentially expressed gene orthologs, most were found to be specifically changed only by one POP (Figure 5(c)). We identified five gene orthologs that were significantly regulated in response to all four POPs corresponding to phosphate butyryltransferase (ptb), small acid-soluble spore protein D (sspD), putative pyrimidine permease RutG (rutG), 2-oxoisovalerate dehydrogenase E1 component (bkdA), and transposase IS5 family (Figure 5(d)), which are associated with butyrate metabolism,21 BCAAs degradation,22 and pyrimidine degradation23 as well as DNA cleavage and modification,24 respectively.
Figure 5.

The transcriptional response of isolated cecal bacteria to POPs exposure in vitro. (a) PCA plot of gene expression of cecal bacteria with vehicle or POPs exposure for 4 h (p-value = 0.002 from each POP compared to vehicle). (b) The Number of differentially expressed gene orthologs for the isolated cecal bacteria with vehicle or POPs exposure for 4 h. (c) Number of pollutant-specific gene orthologs shared between each POP. (d) The gene orthologs significantly regulated in response to all four of POPs. (e) Integrated and visualized tricarboxylic acid (TCA) cycle using metatranscriptomics data combined with metabolomics data. (f) Integrated and visualized glycolysis pathway using metatranscriptomics data combined with metabolomics data. (n = 6 per group)
Analysis of the KEGG module and pathway enrichment confirmed and extended these trends (Table 1). Pathways including tricarboxylic acid (TCA) cycle, glycolysis, amino acid biosynthesis, nucleotide metabolism, and fermentation pathways were integrated and visualized using metatranscriptomics data combined with metabolomics data (Figure 5(e-f) and Supplementary Fig. 2–4). Although each POP induced specific transcriptomic responses, some general trends were shared, such as transcript levels related to the TCA cycle, carbon metabolism, carbon fixation pathways, and protein export (Table 1). For example, the TCA cycle and glycolysis pathways were significant enriched by exposure to most POPs, especially PCB 153 (6 µM), supported by significantly higher levels of gene orthologs and intermediates in pathways (Figure 5(e-f)). Of particular note, PCB 153 exposure (6 µM) resulted in distinct changes in bacterial transcript levels compared to other POPs, such as fatty acid biosynthesis, lipopolysaccharide (LPS) biosynthesis, vitamin B6 metabolism, mismatch repair, and base excision repair (Table 1).
Table 1.
Pathway enrichment analysis of metatranscriptomic data
| Pathways |
TCDF |
TCDD |
PCB 126 |
PCB 153 |
| Tricarboxylic cycle (TCA cycle) | ** | *** | * | |
| Carbon metabolism | *** | ** | ** | * |
| Propanoate metabolism | *** | *** | ||
| Carbon fixation pathways | ** | ** | * | |
| Glutathione metabolism | * | * | ||
| Amino sugar and nucleotide sugar metabolism | * | * | ||
| Pyruvate metabolism | * | ** | * | |
| Biosynthesis of amino acids | * | |||
| Pentose phosphate pathway | * | ** | ||
| Biosynthesis of secondary metabolites | * | |||
| Protein export | * | * | ** | |
| Phosphotransferase system (PTS) | **** | * | ||
| Fructose and mannose metabolism | ** | ** | ||
| Styrene degradation | ** | |||
| Butanoate metabolism | ** | * | ||
| Glycolysis/Gluconeogenesis | ** | |||
| Purine metabolism | * | |||
| Flagellar assembly | * | * | ||
| Glycosaminoglycan degradation | * | |||
| Central carbon metabolism in cancer | * | |||
| ABC transporters | * | |||
| Lipoic acid metabolism | * | ** | ||
| Bacterial chemotaxis | * | * | ||
| Homologous recombination | *** | |||
| Vitamin B6 metabolism | *** | |||
| Mismatch repair | ** | |||
| Lipopolysaccharide biosynthesis | ** | |||
| Starch and sucrose metabolism | ** | |||
| DNA replication | * | |||
| Fatty acid biosynthesis | * | |||
| Pyrimidine metabolism | * | |||
| Glycine, serine and threonine metabolism | * | |||
| Base excision repair | * |
Pathway enrichment analysis using the metatranscriptomic results comparing vehicle with POPs exposure. P value was calculated by a student’s t test. * p < 0.05, ** p < 0.01, *** p < 0.001, **** p < 0.0001
To further explore the transcriptomic responses of specific bacteria following POP exposure, five representative bacteria including Bacteroides, Clostridium, Lactobacillus, Bifidobacterium, and Fusobacterium were mapped to their reference sequences (Supplementary Table 3). The differentially expressed gene orthologs induced by four POPs compared to a vehicle from these five genera are listed in Supplementary Tables 4–8. In total, we identified 125 gene orthologs differentially expressed after TCDF exposure (6 µM), 96 gene orthologs differentially expressed after TCDD exposure (0.6 µM), 98 gene orthologs differentially expressed after PCB 126 exposure (6 µM), and 234 gene orthologs differentially expressed after TCDF exposure (6 µM) in Bacteroides (Supplementary Table 4). Bifidobacterium and Fusobacterium have less differentially expressed gene orthologs by POPs exposure, which could be due to the reduced mRNA that mapped to their reference sequences (Supplementary Tables 3 and 7–8). Consistent with isolated cecal bacteria results, PCB 153 exposure resulted in a greater impact on these five individual bacteria than other POPs at the transcriptional levels (Supplementary Tables 3–8).
The physiologic and metabolic effect of POPs on individual bacteria species in vitro
Having defined the transcriptomic responses of specific bacteria with POPs exposure, we sought to explore the physiologic and metabolic effect of POPs on individual bacteria. Gram-negative and Gram-positive bacteria are have different cell wall structures that play a variety of protective and adaptive roles.25,26 In order to explore the specific effect of POPs on Gram-negative and Gram-positive bacteria, we combined growth rate measurements (OD600) and flow cytometry with UPLC-MS-based metabolomics to investigate the responses of POPs on six individual bacteria species. Six bacterial species were used including three Gram-positive bacteria (Lactobacillus paracasei, Bifidobacterium longum, and Clostridium ramosum) and three Gram-negative bacteria (Fusobacteria nucleatum, Bacteriodes fragilis (638 R), and Bacteriodes fragilis (ATCC®25282TM)), which are found in the gut of healthy individuals and play a key role in host metabolism.27,28
We combined flow cytometry with optical density (OD600) over 18 h to monitor the impact of POPs on the growth and physiologic status of six bacteria species (Figure 6 and Supplementary Figure 5–6). No significant effects were observed in the growth rate and physiologic status in most bacteria species including Bacteriodes fragilis (ATCC®25282TM), Bacteriodes fragilis (638 R), Fusobacteria nucleatum, and Clostridium ramosum following exposure to two doses of four POPs for 18 h (Supplementary Figure 5–6), indicating no significant cell damage following POP exposure to those bacteria species. The significant decreases in the growth of Bifidobacterium longum were observed with a higher dose of TCDF (6 µM) and TCDD (0.6 µM) and two doses of PCB 126 and PCB 153 exposure, while subtle decreases were observed with a lower dose of TCDF (0.6 µM) and TCDD (0.06 µM) exposure (Figure 6(a)). Consistent with the OD600 results, two doses of PCB 153 (0.6 µM and 6 µM) and a higher dose of PCB 126 (6 µM) exposure significantly increased the proportions of damaged cells (Pi and DiBAC4-stained cells) and decreased CFDA-stained bacteria (Figure 6(c)), suggesting dramatic changes to the physiological status of Bifidobacterium longum after 18 h POPs exposure. POPs exposure did not result in dramatic changes in the growth of Lactobacillus paracasei but a subtle increase in the growth of Lactobacillus paracasei, which is indicated by the increased growth rate and a significant decrease in Pi-stained bacteria with POPs exposure (Figure 6(b) and 6(d)).
Figure 6.
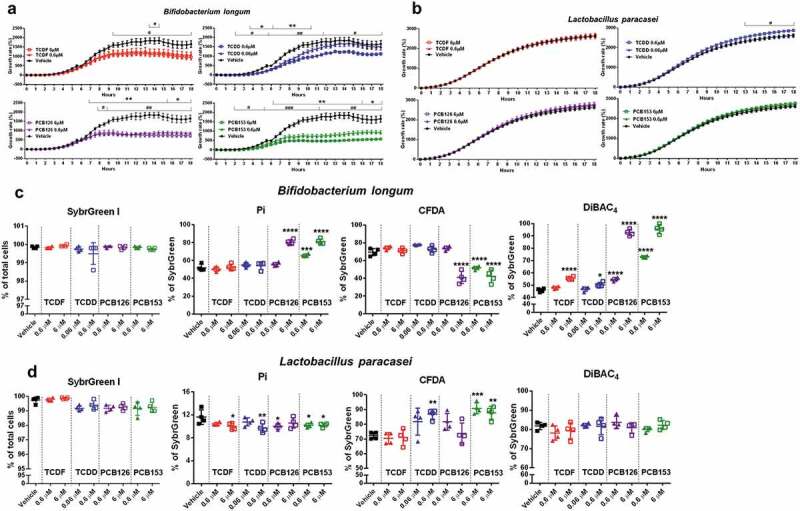
The growth rate and physiological response of individual species to POPs exposure in vitro. (a-b) Growth rate of Bifidobacterium longum (a) and Lactobacillus paracasei (b) with vehicle or two doses of POPs exposure as measured by absorbance (OD600) over 18 hours.Values are means ± S.D. (n = 5 per group), *P < .05, ** P < .01, *** P < .001, lower dose compare to vehicle; # P < .05, ## P < .01, ### P < .001 higher dose compare to vehicle.(c-d) Flow cytometric analyses of proportions of SybrGreen, Pi, CFDA, and DiBAC4-stained cells from Bifidobacterium longum (c) and Lactobacillus paracasei (d) with vehicle or two doses of POPs exposure for 18 h. (n = 4). * P < .05, ** P < .01, *** P < .001, **** P < .0001 compare to vehicle
Having determined the significant changes in lipid profiling in cecal bacteria with POP exposure, we sought to investigate the influence of POPs on the lipid metabolism of these six bacteria species (Figure 7 and Supplementary Figure 7–18). To visualize the patterns of lipid metabolism of six bacteria species following POP exposure, the log2 fold change values of lipid profiles obtained from UPLC-MS were assembled using self-organizing maps (SOMs) and projected onto suprahexagonal landscapes (Figure 7 and Supplementary Figure 7–18). These maps display the “metabolic fingerprint” for six bacteria species following POP exposure and provide a means to visually interpret complex lipid changes. The six bacteria species showed extreme variation in lipid composition in response to TCDD, TCDF, or PCBs exposure in both positive and negative modes, with increases of most lipids in Lactobacillus paracasei with POPs exposure and decreases of most lipids in Clostridium ramosum with POPs exposure (Figure 7, Supplementary Figs. 8–9, and Supplementary Figs. 14–15). Notably, two strains of Bacteriodes fragilis also showed different responses to POP exposure, with Bacteriodes fragilis (ATCC®25282TM) being more sensitive (Figure 7, Supplementary Figs. 11–12, and Supplementary Figs. 17–18). Moreover, most individual bacteria species, such as Bifidobacterium longum, Clostridium ramosum, Fusobacteria nucleatum, and Bacteriodes fragilis (ATCC®25282TM) are more sensitive to (non-coplanar) PCB-153 than (coplanar) PCB-126 (Figure 7). It is interesting to note that limited significant effects in hydrophilic metabolites were observed following exposure to two doses of POPs in Lactobacillus paracasei and Bifidobacterium longum (Supplementary Figs. 19–20 and Supplementary Tables 9–10).
Figure 7.

UPLC-MS/MS-based metabolomics analysis of lipid profiling from individual species to POPs exposure in vitro. Lipids were automatically arranged within an optimal supra-hexagon using the Suprahex package for R/Bioconductor. The map preserves the input information and provides the underlying cluster details such as the dimensionality, distribution, distance, clusters, and identity of metabolites (Supplementary Figure 7–18). The map also functions to place the most significantly changed metabolites on the outer portion of the map. MetaPrints based on the lipid profiling derived from UPLC-MS/MS positive (a) and negative (b) modes of Bifidobacterium longum, Lactobacillus paracasei, Clostridium ramosum, Fusobacteria nucleatum, Bacteriodes fragilis (ATCC®25282TM), and Bacteriodes fragilis (638 R), denoted as the log2 fold change relative to vehicle, following POPs exposure for 18 h. (n = 4 per group)
Discussion
Concerns regarding the effects of POPs on the gut microbiota have increased in recent years.10,12,18 Mounting laboratory animal studies report that POP exposure might alter the microbial community structure and/or the metabolic activities, leading to host disorders.13,20,29 In this study, we investigated the direct impact of four POPs on the gut microbiota at the physiological, metabolic, and transcriptional levels using in vitro systems. The four POPs used in this work: (i) TCDF, considerable shorter half-life in rodents;13 (ii) TCDD, the most potent aryl hydrocarbon receptor agonist;30 and (iii) two PCBs (coplanar PCB 126 and noncoplanar PCB 153), are known to have a different degree of toxicity.31 We report a systematic study that probes the direct interactions between POPs and gut microbiota and provide a new perspective of POP toxicity.
The direct metabolic and physiologic responses of cecal bacteria to short-term POP exposure were observed in vitro. Short-term POPs exposure led to a dose-dependent decrease in metabolic activity in cecal bacteria that is associated with increased low nucleic acid (LNA) bacteria and decreased high nucleic acid (HNA) bacteria. LNA populations have a decreased rate of metabolic activity compared to HNA.32 Similar observations have been reported with antibiotics and anti-inflammatory drug studies that showed the effective antibacterial activity in vitro.32,33 However, no significant cell damage was observed with POP exposure in cecal bacteria, supported by no changes in SybrGreen, Pi, and DiBAC4 stained cells. It is interesting to note that the analysis of microbial metabolism after short-term POPs exposure revealed disturbances in multiple metabolic pathways, which were not fully consistent with what we observed in vivo with TCDF oral exposure.13 These variations between in vitro and mouse studies could be attributed to the host-microbiota axis that involves crosstalk between the host and the microbiome. This notion is supported by the observation that TCDF-mediated changes are aryl hydrocarbon receptor (AHR)-dependent as no significant changes in the fecal or cecal content of Ahr-null mice following TCDF exposure were observed.13
One of the most prominent findings in this study was the profound changes in bacterial lipid profiles following POPs exposure. POPs are mainly lipid-soluble chemicals that accumulate in the membrane bilayer between the acyl chains of fatty acids and increase membrane fluidity.34 An increase in lipid saturation is the most common mechanism used to modulate membrane fluidity, which helps cells survive under long-term adverse conditions.34,35 Consistently, our data showed that PCB 153 exposure resulted in an increased ratio of bacterial saturated to unsaturated fatty acids and significantly changed fatty acid biosynthesis, suggesting a rapid change in bacterial membrane fluidity in response to PCB 153. It is interesting to note that six individual bacteria species including three Gram-positive bacteria (Lactobacillus paracasei, Bifidobacterium longum, and Clostridium ramosum) and three Gram-negative bacteria (Fusobacteria nucleatum and two Bacteriodes fragilis) show extreme variation in lipid metabolism following exposure to the four POPs used in this study. The reason for this variation might be partially attributed to adaptation mechanisms for bacteria to survive under adverse conditions. Bacterial strains surviving in the environment must cope with the toxic compounds and counteract damage to the cytoplasmic membrane and cell wall that represents the initial contact between the cell and toxic compounds.34 Surprisingly, we did not observe a distinct pattern of lipid metabolism in Gram-positive and Gram-negative bacteria by POPs exposure, despite the difference in the cell wall structure. This observation suggests more studies are warranted to determine the factor(s) important for the heterogeneous response of bacteria to POPs.
Another prominent finding in this study was the integrated and detailed characterization of the altered metabolic pathways using metatranscriptomics data combined with metabolomics data. Oral POP treatment modulated the microbial community,13,20 which was not fully consistent with what we observed in the in vitro study. The differences could be due to intervention duration and/or the lack of host-mediated processes in in vitro systems. We identified general transcriptional responses to most POPs related to energy metabolism pathways including the TCA cycle, butyrate metabolism, and pyruvate metabolism, supported by our metabolomics data. Similar observations have been reported in a previous mouse study20 and an in vitro study that reported a dose–dependent inhibitory effect and a disruption in bacterial fermentation processes by PCB 126 exposure using a mouse fecal culture.36 The direct in vitro effects may translate into microbiome shifts in vivo, which contribute to the disruption of glucose tolerance in host with POPs exposure.36 The disturbances of bacterial energy metabolism pathways might affect a range of host processes including energy utilization, host-microbe signaling, and anti-inflammatory effects.13,37 Protein export is an essential function for a variety of bacteria to eliminate toxic byproducts, produce, and excrete essential growth factors, and acquire nutrient.38 Disruption in protein export was also observed with POP exposure, indicating the disruption in the bacterial secretion system by POPs exposure might lead to the disruption in the host innate immune system.39 Protein transport systems in Gram-positive and Gram-positive bacteria are varied, due to the differences in their cell envelope structure.40 It will be interesting to see whether POPs cause varied responses in protein transport to Gram-positive and Gram-positive bacteria in the future work. Notably, our results also emphasized many distinct transcriptional responses of PCB 153 on the cecal bacteria, including the induction of bacterial membrane biogenesis,41 stress response pathways,20 and defense of DNA damage.42
Exposure to (non-coplanar) PCB-153 resulted in a more dramatic metabolic and transcriptional response to bacteria relative to (coplanar) PCB-126. Coplanar PCB-126 has similar biological properties to TCDD, showing toxic effects primarily through activation of AHR.43,44 The non-coplanar PCBs, on the other hand, exhibit different biological activities and more complex routes of toxicity.45 Interestingly, our data showed that PCB-153 had the strongest effects on bacteria, whether assessing metabolic response or gene expression. This could be partially explained by higher membrane fluidity caused by PCB-153, resulting in a greater impact on bacterial membrane properties and membrane destruction.46 This observation was consistent with the experiments performed on liposomes,46 cell lines,47 and model bacterial membranes,48 indicating the physiological effects of non-coplanar POPs may be greater compared to coplanar POPs. These in vitro findings need to be tested rigorously in vivo (in animal models) to better appreciate the importance of the host response.
Many environmental pollutants influence the gut microbiota yet quantifiable or biologically meaningful endpoints that reflect this toxicity have not been evaluated. As those used for animal or human studies, such as alanine aminotransferase (ALT) and aspartate transaminase (AST) for liver damage or C-reactive protein (CRP) for muscle damage, the toxicity endpoints for understanding the response of the microbiome to the environmental pollutants need to be assessed. The results described here identify possible new avenues for probing microbial toxicity by environment pollutant exposure.
Materials and methods
Chemicals
POPs including TCDD, TCDF, PCB-126, and PCB-153 (Figure 1(c)) were purchased from Cambridge Isotope Laboratories, Inc. (Tewksbury, MA) and suspended in dimethyl sulfoxide (Sigma-Aldrich, St. Louis, MO). The fluorescent dyes including SybrGreen, propidium iodide (Pi), carboxyfluorescein diacetate (CFDA), and bis-(1,3-dibutylbarbituric acid) trimethine oxonol (DiBAC4) were ordered from Sigma-Aldrich (St. Louis, MO) and Invitrogen (Carlsbad, CA).
In vitro bacterial culture and incubation
Cecal microbiota incubation studies were modified from previously described protocols.33 Briefly, cecal contents were isolated from 7-week-old C57BL/6 J male wild type mice and diluted with brain heart infusion broth (1 g in 10 ml). The cecal suspensions were incubated with two doses of TCDD (high: 0.6 µM and low: 0.06 µM), TCDF (high: 6 µM and low: 0.6 µM), and PCBs (high: 6 µM and low: 0.6 µM) at 37°C for 4 h. The high dose (6 µM) of TCDF and PCBs is equivalent to the dose of TCDF that we have previously published in vivo studies.13,20 After incubation, bacterial samples were washed and stained for flow cytometry analysis or kept at −80°C for other analyses.
Six individual bacteria species including Bifidobacterium longum (ATCC®15707TM), Lactobacillus paracasei (ATCC®25303TM), Fusobacteria nucleatum subsp. nucleatum (ATCC®25586TM), Clostridium ramosum (ATCC®25582TM), Bacteriodes fragilis (ATCC®25282TM), and Bacteriodes fragilis (638 R) were cultured and treated with two doses of TCDD (high: 0.6 µM and low: 0.06 µM), TCDF (high: 6 µM and low: 0.6 µM), and PCBs (high: 6 µM and low: 0.6 µM) at 37°C for 18 h (for more detailed methods about bacteria culture, see Supplemental Material). The effects of POPs on the growth rate of different bacteria in vitro were measured by optical density (OD600) using a Multiskan Sky Microplate spectrophotometer (Thermo Fisher Scientific, Waltham, MA). Flow cytometry and metabolite analysis were performed after 18 h of POPs incubation. All experiments were performed in a monitored anaerobic chamber (Coy Laboratory Products, 95% N2, 5% H2) and repeated at least three times.
Flow cytometry analysis
After incubation, the bacterial mixtures and individual bacteria species were washed twice and resuspended with 1X reduced PBS (1 mg/ml L-cysteine). Bacterial physiology was assessed by four fluorescent dyes: SybrGreen that stains all nucleic acids regardless of cellular damage, Pi that stains only dead or damaged cells, CFDA that stains for enzymatic/metabolic activity, and DiBAC4 that stains damaged bacteria.33,49 All cytometric analyses were performed using a BD Accuri™ C6 plus flow cytometer (BD Biosciences, San Jose, CA) and data were analyzed with FlowJo V10 software (FlowJo, LLC). The percentages of Pi, CFDA, DiBAC4, low nucleic acid (LNA), and high nucleic acid (HNA) stained cells were calculated relative to the total bacterial counts obtained by SybrGreen staining.
1H NMR-based metabolomics experiments
The hydrophilic metabolites and lipids from 1 ml of bacteria were extracted twice with 1 ml pre-cooled methanol/H2O (2:1, v/v) or chloroform/methanol (2:1, v/v), followed by three freeze-thaw cycles. After evaporation, the extracts were reconstituted in 500 µl of 0.1 M PBS containing 100% D2O and 0.005% (v/v) 3-(trimethysilyl) [2,2,3,3–2H4] propionate (TSP) (hydrophilic metabolites) or deuterated chloroform containing 0.03% (v/v) tetramethylsilane (TMS) (lipids) and analyzed with a Bruker Avance NEO 600 MHz spectrometer equipped with an inverse cryogenic probe (Bruker Biospin, Germany) at 298 K. A typical 1D NMR spectrum named NOESYPR1D was acquired for both hydrophilic and lipid extracts. Metabolite assignments were carried out on the basis of a set of 2D NMR spectra and published results.19,49
All 1H NMR spectra were phase- and baseline-corrected and referenced to TSP (δ = 0.0) for hydrophilic metabolites or TMS (δ = 0.0) for lipids using TopSpin 3.6 (Bruker Biospin). The spectra were integrated into 0.004 ppm-width buckets using the AMIX 3.8 (Bruker Biospin). Principal component analysis (PCA) was performed using the SIMCA 13.0.3 (Umetrics, Umea, Sweden). Heatmaps were plotted using RStudio (pheatmap). The relative levels for representative fatty acids including the molar percentages of unsaturated fatty acids (UFA%), saturated fatty acids (SFA%), polyunsaturated fatty acids (PUFA%), monounsaturated fatty acids (MUFA%), and SFA-to-UFA ratio (SFA/UFA) were also calculated as previously reported.50 These calculations were based on the spectral integral areas (Supplementary Fig. 21) for – CH= CH – (from UFA, δ 5.38), – CH3 (from all fatty acids, δ 0.84), = CH–CH2–CH = (from PUFA, δ 2.76) taking into consideration of proton numbers; the signal area for SFA and MUFA was calculated by subtracting that for UFA from 1 and PUFA from UFA.
LC-MS based metabolomics experiments
Bacteria species samples (0.6 ml) were extracted with 1 ml of pre-cool chloroform/methanol (2:1, v/v). After homogenization, the samples were added 250 µl of HPLC water and vortexed, followed by centrifugation (22,000 rpm, 4°C for 10 min). The top phase was collected for hydrophilic metabolites and the upper phase was collected for lipid analysis. Two phases were dried in a vacuum and reconstituted in 60 μl of 3% methanol containing 1 µM chlorpropamide (hydrophilic metabolites) or 100 μl of isopropanol/acetonitrile/H2O (50:25:25, v/v/v) containing 1 µM 15:0–18:1-d7-PC (lipids). After centrifugation, supernatants were transferred to autosampler vials for LC-MS analysis.
Hydrophilic metabolite analysis was performed with a Dionex Ultimate 3000 quaternary HPLC system connected to ExactiveTM Plus Orbitrap mass spectrometer (Thermo Fisher Scientific, Waltham, MA) with a Hydro-RP C18 column (2.1 × 100 mm × 2.5 µm particle size; Phenomenex, Torrance, CA). Samples for lipid profiling were separated by reverse-phase HPLC using a Vanquish UHPLC system (Thermo Fisher Scientific, Waltham, MA) with a Waters (Milford, MA) CSH C18 column (1.0 × 150 mm × 1.7 um particle size). The eluate was delivered into an Orbitrap Fusion Lumos Tribrid™ mass spectrometer using a H-ESI™ ion source (all Thermo Fisher Scientific) (for more detailed methods about LC-MS, see Supplemental Material). LC-MS data were analyzed by the open-source software MS-DIAL.51 MetaMapp network analysis for hydrophilic metabolite was performed to visualize and integrate biochemical and chemical similarities as previously described.52 The colors of each node such as red and blue represent up- or down-regulation compared to the vehicle. The size and shape of nodes represent fold-change and class of metabolites. The log2 fold changes of lipids from each POPs exposure compared to the vehicle group were trained a self-organizing map (SOM) and projects onto a two-dimensional suprahexagon using the Suprahex package for R/Bioconductor.53 These suprahexagons arrange related metabolites within nodes or small hexagons, that are further arranged based on vector weight. The map preserves the input information and provides the underlying cluster details such as the dimensionality, distribution, distance, clusters, and identity of metabolites.
Metatranscriptomic analysis
The cecal bacterial metatranscriptomic analysis was done as previously described20 (Figure 1(b)). Briefly, total RNA was isolated from 1 ml of cecal bacterial mixtures by 1 ml of Trizol and purified with RNeasy® Mini Kit twice (QIAGEN, Hilden, Germany). The total RNA was measured and checked by an Agilent Bioanalyzer. The 16S and 23S rRNA fractions were removed from total RNA using the RiboMinusTM Bacteria Transcriptome Isolation kit (Invitrogen, Carlsbad, CA) and purified with RNeasy® MinElute® Cleanup Kit (QIAGEN, Hilden, Germany). The deletion of 16S and 23S rRNA was checked again with the Agilent Bioanalyzer. The rRNA depleted bacterial RNA samples were submitted to the Pennsylvania State University Genomic Sequencing core for sequencing. TruSeq Stranded mRNA kit was used to make a uniquely indexed library from each sample and then sequenced on Illumina NextSeq High-Output 150 nt single read sequencing run.
The obtained sequences were subjected to quality check using FastQC with a minimum Phred score of 30. Low-quality sequences and adapters were removed using Cutadapt54 with a quality cutoff of Phred score 30 and adapter sequences recommended for TruSeq Stranded mRNA kits. The quality-controlled trimmed reads were then subjected to ribosomal RNA (rRNA) filtering using SortMeRNA.55 Using the Silva database,56 all the sequences identified as rRNA were removed to obtain a pool of non-ribosomal rRNA. The non-ribosomal rRNA were then subjected to functional annotation using FMAP.57 Briefly, the non-ribosomal rRNA was mapped to the Uniref90 protein database using Diamond.58 The uniport ids were mapped to KEGG Orthologs and the abundances of KEGG Orthologs were calculated using FMAP with default parameters. The counts were normalized to the total number of reads in each sample. Exploratory analysis was done using MicrobiomeAnalyst.59 PerMANOVA (adonis function in vegan R package) was used to evaluate the effect of treatment on Bray-Curtis distance matrices with 999 random permutations. Each treatment group (TCDD, TCDF, PCB-126, and PCB-153) was individually compared to the vehicle group. Differential abundance analysis was tested using Mann-Whitney-Wilcoxon tests. Multiple test correction was performed by calculating False Discovery Rate-adjusted p-value using the Benjamini-Hochberg method with a threshold of p-value <0.05 and p.adjust <0.5. The significantly different KEGG Orthologs were selected for visualizations and further analysis.
Investigations into the effect of POPs on specific bacteria in the gut microbiome was carried out using a custom pipeline. Sequences pertaining to five representative genera of gut microbiota: Bacteroides, Clostridium, Lactobacillus, Bifidobacterium, and Fusobacterium were downloaded from NCBI Reference sequence databases. Filtered mRNA were mapped to these reference sequences using Diamond58 using default parameters. The abundance of each gene was calculated by counting the number of hits in the reference database. The counts were normalized to the total number of reads in each sample. For each bacterium, differentially expressed gene orthologs for each POP were calculated using the student t-test. Multiple test corrections were performed by calculating False Discovery Rate-adjusted p-value using the Benjamini-Hochberg method with a threshold of p-value <0.05 and p.adjust <0.05.
Metatranscriptomic and metabolomics data integration and visualization
Metabolomics data and metatranscriptomics data were visualized using MetaboMaps.60 Pathways were condensed into a custom figure. The enzymes were mapped to gene orthologs. Log2Fold changes in metabolite and gene orthologs were plotted on the graph as circle and box heatmaps.
Sanger sequencing and 16S rRNA gene sequencing analysis
Bacteria DNA from bacterial mixtures and individual bacteria species was extracted using the E.Z.N.A. stool DNA kit (Omega Bio-Tek Inc., Norcross, GA). Bacterial species used throughout the study were confirmed by Sanger sequencing as previously described61 and the result was analyzed with BLAST (Supplementary Table 11). The DNA from cecal bacterial mixtures was analyzed using 16S rRNA gene sequencing as described.62 Briefly, the extracted bacterial DNA was amplified using the V4V4 primer set (515 F and 806 R). The product quality was assessed using 1% agarose gel electrophoresis and a DNA 7500 LabChip on the Agilent 2100 Bioanalyzer (Agilent Technologies, Santa Clare, CA). The sequencing was performed on the Illumina MiSeq platform at Penn State Genomics Core Facility (University Park, PA) and analyzed using the mothur platform.63 The Generalized Unifrac analysis was performed using a phylogenic tree and operational taxonomic unit (OTU) table by R studio.63
Statistics
All data values are expressed as mean ± standard deviation (SD). Graphical illustrations and statistical analyses were performed using GraphPad Prism 6.0 (GraphPad, San Diego, CA). One-way analysis of variance (ANOVA) followed by Dunnett’s multiple comparisons was used.
Supplementary Material
Acknowledgments
We thank the Penn State Metabolomics Facility. We also thank Dr. Ruixin Hao for preliminary discussions that helped advance this work.
Funding Statement
This work was supported by the NIH (ES028288), the Pennsylvania Department of Health using Tobacco CURE funds, and the USDA National Institute of Food and Federal Appropriations under Project PEN04607 and Accession number 1009993.
Disclosure of potential conflicts of interest
No potential conflicts of interest were disclosed.
Supplementary material
Supplemental data for this article can be accessed on the publisher’s website.
References
- 1.Lim J-E, Nam C, Yang J, Rha KH, Lim K-M, Jee SH.. Serum persistent organic pollutants (POPs) and prostate cancer risk: A case-cohort study. International Journal of Hygiene and Environmental Health. 2017;220(5):849–856. doi: 10.1016/j.ijheh.2017.03.014. [DOI] [PubMed] [Google Scholar]
- 2.Koual M, German CS, Anne SB, Celine T, Yael KA, Nathalie DH, Charlotte N, Helene B, Myriam D, Fabrice L, et al. Associations between persistent organic pollutants and risk of breast cancer metastasis. Environ Int. 2019;132:105028. doi: 10.1016/j.envint.2019.105028. [DOI] [PubMed] [Google Scholar]
- 3.Vafeiadi M, Vrijheid M, Fthenou E, Chalkiadaki G, Rantakokko P, Kiviranta H, Kyrtopoulos SA, Chatzi L, Kogevinas M. Persistent organic pollutants exposure during pregnancy, maternal gestational Weight gain, and birth outcomes in the mother-child cohort in Crete, Greece (RHEA study). Environ Int. 2014;64:116–123. doi: 10.1016/j.envint.2013.12.015. [DOI] [PubMed] [Google Scholar]
- 4.Ren AG, Qiu XH, Jin L, Ma J, Li ZW, Zhang L, Zhu HP, Finnell RH, Zhu T. Association of selected persistent organic pollutants in the placenta with the risk of neural tube defects. Proc Natl Acad Sci U S A. 2011;108:12770–12775. doi: 10.1073/pnas.1105209108. [DOI] [PMC free article] [PubMed] [Google Scholar]
- 5.Gascon M, Morales E, Sunyer J, Vrijheid M. Effects of persistent organic pollutants on the developing respiratory and immune systems: A systematic review. Environ Int. 2013;52:51–65. doi: 10.1016/j.envint.2012.11.005. [DOI] [PubMed] [Google Scholar]
- 6.Damstra T. Potential effects of certain persistent organic pollutants and endocrine disrupting chemicals on the health of children. J Toxicol Clin Toxicol. 2002;40:457–465. doi: 10.1081/clt-120006748. [DOI] [PubMed] [Google Scholar]
- 7.Vested A, Giwercman A, Bonde JP, Toft G. Persistent organic pollutants and male reproductive health. Asian J Androl. 2014;16:71–80. doi: 10.4103/1008-682x.122345. [DOI] [PMC free article] [PubMed] [Google Scholar]
- 8.Magliano DJ, Loh VHY, Harding JL, Botton J, Shaw JE. Persistent organic pollutants and diabetes: A review of the epidemiological evidence. Diabetes Metab. 2014;40:1–14. doi: 10.1016/j.diabet.2013.09.006. [DOI] [PubMed] [Google Scholar]
- 9.Lee DH, Porta M, Jacobs DR, Vandenberg LN. Chlorinated persistent organic pollutants, obesity, and type 2 diabetes. Endocr Rev. 2014;35:557–601. doi: 10.1210/er.2013-1084. [DOI] [PMC free article] [PubMed] [Google Scholar]
- 10.Jin YX, Wu SS, Zeng ZY, Fu ZW. Effects of environmental pollutants on gut microbiota. Environmental Pollution. 2017;222:1–9. doi: 10.1016/j.envpol.2016.11.045. [DOI] [PubMed] [Google Scholar]
- 11.National academies of sciences, E. & Medicine . Environmental chemicals, the human microbiome, and health risk: a research strategy. The National Academies Press; 2018. 10.17226/24960 [DOI] [PubMed] [Google Scholar]
- 12.Claus SP, Guillou H, Ellero-Simatos S. The gut microbiota: a major player in the toxicity of environmental pollutants? NPJ Biofilms Microbi. 2016;2:17001. doi: 10.1038/npjbiofilms.2016.3. [DOI] [PMC free article] [PubMed] [Google Scholar]
- 13. Zhang LM, Nichols RG, Correll J, Murray IA, Tanaka N, Smith PB, Hubbard TD, Sebastian A, Albert I, Hatzakis E, et al. Persistent organic pollutants modify gut microbiota-host metabolic homeostasis in mice through aryl hydrocarbon receptor activation. Environ Health Perspect. 2015;123:679–688. doi: 10.1289/ehp.1409055. [DOI] [PMC free article] [PubMed] [Google Scholar]
- 14.Rooks MG, Garrett WS. Gut microbiota, metabolites and host immunity. Nat Rev Immunol. 2016;16:341–352. doi: 10.1038/nri.2016.42. [DOI] [PMC free article] [PubMed] [Google Scholar]
- 15.Belkaid Y, Hand TW. Role of the microbiota in immunity and inflammation. Cell. 2014;157:121–141. doi: 10.1016/j.cell.2014.03.011. [DOI] [PMC free article] [PubMed] [Google Scholar]
- 16.Tilg H, Moschen AR. Microbiota and diabetes: an evolving relationship. Gut. 2014;63:1513–1521. doi: 10.1136/gutjnl-2014-306928. [DOI] [PubMed] [Google Scholar]
- 17.Nicholson JK, Holmes E, Kinross J, Burcelin R, Gibson G, Jia W, Pettersson S. Host-gut microbiota metabolic interactions. Sci. 2012;336:1262–1267. doi: 10.1126/science.1223813. [DOI] [PubMed] [Google Scholar]
- 18.Snedeker SM, Hay AG. Do interactions between gut ecology and environmental chemicals contribute to obesity and diabetes?. Environ Health Perspect. 2012;120:332–339. doi: 10.1289/ehp.1104204. [DOI] [PMC free article] [PubMed] [Google Scholar]
- 19.Zhang LM, Hatzakis E, Nichols RG, Hao RX, Correll J, Smith PB, Chiaro CR, Perdew GH, Patterson AD. Metabolomics reveals that aryl hydrocarbon receptor activation by environmental chemicals induces systemic metabolic dysfunction in mice. Environ Sci. 2015;49:8067–8077. doi: 10.1021/acs.est.5b01389. [DOI] [PMC free article] [PubMed] [Google Scholar]
- 20.Nichols RG, Zhang JT, Cai JW, Murray IA, Koo I, Smith PB, Perdew GH, Patterson AD. Metatranscriptomic analysis of the mouse gut microbiome response to the persistent organic pollutant 2,3,7,8-tetrachlorodibenzofuran. Metabolites. 2020;10:1. doi: 10.3390/metabo10010001. [DOI] [PMC free article] [PubMed] [Google Scholar]
- 21.Vital M, Howe AC, Tiedje JM. Revealing the bacterial butyrate synthesis pathways by analyzing (meta) genomic data. Mbio. 2014;5:e00889. doi: 10.1128/mBio.00889-14. [DOI] [PMC free article] [PubMed] [Google Scholar]
- 22.Sprusansky O, Stirrett K, Skinner D, Denoya C, Westpheling J. The bkdR gene of Streptomyces coelicolor is required for morphogenesis and antibiotic production and encodes a transcriptional regulator of a branched-chain amino acid dehydrogenase complex. J Bacteriol. 2005;187:664–671. doi: 10.1128/jb.187.2.664-671.2005. [DOI] [PMC free article] [PubMed] [Google Scholar]
- 23.Kim KS, Pelton JG, Inwood WB, Andersen U, Kustu S, Wemmer DE. The rut pathway for pyrimidine degradation: novel chemistry and toxicity problems. J Bacteriol. 2010;192:4089–4102. doi: 10.1128/jb.00201-10. [DOI] [PMC free article] [PubMed] [Google Scholar]
- 24.Setlow B, Sun DX, Setlow P. Interaction between DNA and alpha/beta-type small, acid-soluble spore protein - A new class of DNA-binding protein. J Bacteriol. 1992;174:2312–2322. doi: 10.1128/jb.174.7.2312-2322.1992. [DOI] [PMC free article] [PubMed] [Google Scholar]
- 25.Miller SI. Antibiotic resistance and regulation of the gram-negative bacterial outer membrane barrier by host innate immune molecules. Mbio. 2016;7:e01541. doi: 10.1128/mBio.01541-16. [DOI] [PMC free article] [PubMed] [Google Scholar]
- 26.Silhavy TJ, Kahne D, Walker S. The bacterial cell envelope. Cold Spring Harb Perspect Biol. 2010:2. doi: 10.1101/cshperspect.a000414. [DOI] [PMC free article] [PubMed] [Google Scholar]
- 27. Sun LL, Xie C, Wang G, Wu Y, Wu Q, Wang XM, Liu J, Deng YY, Xia JL, Chen B, et al. Gut microbiota and intestinal FXR mediate the clinical benefits of metformin. Nat Med. 2018;24:1919–1929. doi: 10.1038/s41591-018-0222-4. [DOI] [PMC free article] [PubMed] [Google Scholar]
- 28. Maier L, Pruteanu M, Kuhn M, Zeller G, Telzerow A, Anderson EE, Brochado AR, Fernandez KC, Dose H, Mori H, et al. Extensive impact of non-antibiotic drugs on human gut bacteria. Nature. 2018;555:623–628. doi: 10.1038/nature25979. [DOI] [PMC free article] [PubMed] [Google Scholar]
- 29.Choi JJ, Eum SY, Rampersaud E, Daunert S, Abreu MT, Toborek M. Exercise attenuates PCB-induced changes in the mouse gut microbiome. Environ Health Perspect. 2013;121:725–730. doi: 10.1289/ehp.1306534. [DOI] [PMC free article] [PubMed] [Google Scholar]
- 30.Mimura J, Fujii-Kuriyama Y. Functional role of AhR in the expression of toxic effects by TCDD. BBA-Gen Subj. 2003;1619:263–268. doi: 10.1016/s0304-4165(02)00485-3. [DOI] [PubMed] [Google Scholar]
- 31.Ovando BJ, Ellison CA, Vezina CM, Olson JR. Toxicogenomic analysis of exposure to TCDD, PCB126 and PCB153: identification of genomic biomarkers of exposure to AhR ligands. Bmc Genomics. 2010;11:583. doi: 10.1186/1471-2164-11-583. [DOI] [PMC free article] [PubMed] [Google Scholar]
- 32.Maurice CF, Haiser HJ, Turnbaugh PJ. Xenobiotics shape the physiology and gene expression of the active human gut microbiome. Cell. 2013;152:39–50. doi: 10.1016/j.cell.2012.10.052. [DOI] [PMC free article] [PubMed] [Google Scholar]
- 33.Tian Y, Cai JW, Gui W, Nichols RG, Koo I, Zhang JT, Anitha M, Patterson AD. Berberine directly affects the gut microbiota to promote intestinal farnesoid X receptor activation. Drug Metab Dispos. 2019;47:86–93. doi: 10.1124/dmd.118.083691. [DOI] [PMC free article] [PubMed] [Google Scholar]
- 34.Murínová S, Dercová K. Response mechanisms of bacterial degraders to environmental contaminants on the level of cell walls and cytoplasmic membrane. Int J Microbiol. 2014;2014:873081. doi: 10.1155/2014/873081. [DOI] [PMC free article] [PubMed] [Google Scholar]
- 35.Denich TJ, Beaudette LA, Lee H, Trevors JT. Effect of selected environmental and physico-chemical factors on bacterial cytoplasmic membranes. J Microbiol Methods. 2003;52:149–182. doi: 10.1016/s0167-7012(02)00155-0. [DOI] [PubMed] [Google Scholar]
- 36.Hoffman JB, Flythe MD, Hennig B. Environmental pollutant-mediated disruption of gut microbial metabolism of the prebiotic inulin. Anaerobe. 2019;55:96–102. doi: 10.1016/j.anaerobe.2018.11.008. [DOI] [PMC free article] [PubMed] [Google Scholar]
- 37.Venegas DP, De la Fuente MK, Landskron G, Gonzalez MJ, Quera R, Dijkstra G, Harmsen HJM, Faber KN, Hermoso MA. Short chain fatty acids (SCFAs)-mediated gut epithelial and immune regulation and its relevance for inflammatory bowel diseases. Front Immunol. 2019:10. doi: 10.3389/fimmu.2019.00277. [DOI] [PMC free article] [PubMed] [Google Scholar]
- 38.Pugsley AP, Schwartz M. Export and secretion of proteins by bacteria. Fems Microbiol Lett. 1985;32:3–38. doi: 10.1016/0378-1097(85)90024-2. [DOI] [Google Scholar]
- 39.Kostakioti M, Newman CL, Thanassi DG, Stathopoulos C. Mechanisms of protein export across the bacterial outer membrane. J Bacteriol. 2005;187:4306–4314. doi: 10.1128/jb.187.13.4306-4314.2005. [DOI] [PMC free article] [PubMed] [Google Scholar]
- 40.Freudl R. Leaving home ain’t easy: protein export systems in gram-positive bacteria. Res Microbiol. 2013;164:664–674. doi: 10.1016/j.resmic.2013.03.014. [DOI] [PubMed] [Google Scholar]
- 41.Parsons JB, Rock CO. Is bacterial fatty acid synthesis a valid target for antibacterial drug discovery? Curr Opin Microbiol. 2011;14:544–549. doi: 10.1016/j.mib.2011.07.029. [DOI] [PMC free article] [PubMed] [Google Scholar]
- 42.Nilsen H, Krokan HE. Base excision repair in a network of defence and tolerance. Carcinogenesis. 2001;22:987–998. doi: 10.1093/carcin/22.7.987. [DOI] [PubMed] [Google Scholar]
- 43.Zhang WS, Sargis RM, Volden PA, Carmean CM, Sun XJ, Brady MJ. PCB 126 and other dioxin-like PCBs specifically suppress hepatic PEPCK expression via the Aryl hydrocarbon receptor. Plos One. 2012;7:e37103. doi: 10.1371/journal.pone.0037103. [DOI] [PMC free article] [PubMed] [Google Scholar]
- 44.Gadupudi GS, Klaren WD, Olivier AK, Klingelhutz AJ, Robertson LW. PCB126-induced disruption in gluconeogenesis and fatty acid oxidation precedes fatty liver in male rats. Toxicol Sci. 2016;149:98–110. doi: 10.1093/toxsci/kfv215. [DOI] [PMC free article] [PubMed] [Google Scholar]
- 45.Fischer LJ, Seegal RF, Ganey PE, Pessah IN, Kodavanti PRS. Symposium overview: toxicity of non-coplanar PCBs. Toxicol Sci. 1998;41:49–61. [DOI] [PubMed] [Google Scholar]
- 46.Totland C, Nerdal W, Steinkopf S. Effects and location of coplanar and noncoplanar PCB in a lipid bilayer: a solid-state NMR study. Environ Sci Technol. 2016;50:8290–8295. doi: 10.1021/acs.est.6b01723. [DOI] [PubMed] [Google Scholar]
- 47.Tan YS, Chen CH, Lawrence D, Carpenter DO. Ortho-substituted PCBs kill cells by altering membrane structure. Toxicol Sci. 2004;80:54–59. doi: 10.1093/toxsci/kfh119. [DOI] [PubMed] [Google Scholar]
- 48.Wojcik A, Bieniasz A, Wydro P, Broniatowski M. The effect of chlorination degree and substitution pattern on the interactions of polychlorinated biphenyls with model bacterial membranes. BBA-Biomembranes. 2019;1861:1057–1068. doi: 10.1016/j.bbamem.2019.03.009. [DOI] [PubMed] [Google Scholar]
- 49.Cai JW, Nichols RG, Koo I, Kalikow ZA, Zhang LM, Tian Y, Zhang JT, Smith PB, Patterson AD. Multiplatform physiologic and metabolic phenotyping reveals microbial toxicity. Msystems. 2018;3:e00123. doi: 10.1128/mSystems.00123-18. [DOI] [PMC free article] [PubMed] [Google Scholar]
- 50.Xu WX, Wu JF, An YP, Xiao CN, Hao FH, Liu HB, Wang YL, Tang HR. Streptozotocin-Induced dynamic metabonomic changes in rat biofluids. J Proteome Res. 2012;11:3423–3435. doi: 10.1021/pr300280t. [DOI] [PubMed] [Google Scholar]
- 51. Tsugawa H, Cajka T, Kind T, Ma Y, Higgins B, Ikeda K, Kanazawa M, VanderGhenst J, Fiehn O, Arita M, et al. MS-DIAL: data-independent MS/MS deconvolution for comprehensive metabolome analysis. Nat Methods. 2015;12:523–526. doi: 10.1038/nmeth.3393. [DOI] [PMC free article] [PubMed] [Google Scholar]
- 52.Barupal DK, Haldiya PK, Wohlgemuth G, Kind T, Kothari SL, Pinkerton KE, Fiehn O. MetaMapp: mapping and visualizing metabolomic data by integrating information from biochemical pathways and chemical and mass spectral similarity. BMC Bioinform. 2012;13:99. doi: 10.1186/1471-2105-13-99. [DOI] [PMC free article] [PubMed] [Google Scholar]
- 53.Allman EL, Painter HJ, Samra J, Carrasquilla M, Llinas M. Metabolomic profiling of the malaria box reveals antimalarial target pathways. Antimicrob Agents Chemother. 2016;60:6635–6649. doi: 10.1128/aac.01224-16. [DOI] [PMC free article] [PubMed] [Google Scholar]
- 54.Martin M. Cutadapt removes adapter sequences from high-throughput sequencing reads. EMBnet J. 2011;17:10–12. [Google Scholar]
- 55.Kopylova E, Noe L, Touzet H. SortMeRNA: fast and accurate filtering of ribosomal RNAs in metatranscriptomic data. Bioinformatics. 2012;28:3211–3217. doi: 10.1093/bioinformatics/bts611. [DOI] [PubMed] [Google Scholar]
- 56.Quast C, Pruesse E, Yilmaz P, Gerken J, Schweer T, Yarza P, Peplies J, Glockner FO. The SILVA ribosomal RNA gene database project: improved data processing and web-based tools. Nucleic Acids Res. 2013;41:D590–D596. doi: 10.1093/nar/gks1219. [DOI] [PMC free article] [PubMed] [Google Scholar]
- 57.Kim JW, Kim MS, Koh AY, Xie Y, Zhan XW. FMAP: functional mapping and analysis pipeline for metagenomics and metatranscriptomics studies. BMC Bioinform. 2016;17:420. doi: 10.1186/s12859-016-1278-0. [DOI] [PMC free article] [PubMed] [Google Scholar]
- 58.Buchfink B, Xie C, Huson DH. Fast and sensitive protein alignment using DIAMOND. Nat Methods. 2015;12:59–60. doi: 10.1038/nmeth.3176. [DOI] [PubMed] [Google Scholar]
- 59.Chong J, Liu P, Zhou GY, Xia JG. Using MICROBIOMEANALYST for comprehensive statistical, functional, and meta-analysis of microbiome data. Nat Protoc. 2020;15:799–821. doi: 10.1038/s41596-019-0264-1. [DOI] [PubMed] [Google Scholar]
- 60.Helmecke J, Schomburg D, Neumann-Schaal M. MetaboMAPS: pathway sharing and multi-omics data visualization in metabolic context. F1000Research 2020;9:288. [DOI] [PMC free article] [PubMed] [Google Scholar]
- 61.Tian Y, Gui W, Koo I, Smith PB, Allman EL, Nichols RG, Rimal B, Cai JW, Liu Q, Patterson AD. The microbiome modulating activity of bile acids. Gut Microbes. 2020;11. doi: 10.1080/19490976.2020.1732268. [DOI] [PMC free article] [PubMed] [Google Scholar]
- 62.Tian Y, Nichols RG, Roy P, Gui W, Smith PB, Zhang JT, Lin YD, Weaver V, Cai JW, Patterson AD, et al. Prebiotic effects of white button mushroom (Agaricus bisporus) feeding on succinate and intestinal gluconeogenesis in C57BL/6 mice. J Funct Foods. 2018;45:223–232. doi: 10.1016/j.jff.2018.04.008. [DOI] [Google Scholar]
- 63.Kozich JJ, Westcott SL, Baxter NT, Highlander SK, Schloss PD. Development of a dual-index sequencing strategy and curation pipeline for analyzing amplicon sequence data on the MiSeq Illumina sequencing platform. Appl Environ Microbiol. 2013;79:5112–5120. doi: 10.1128/aem.01043-13. [DOI] [PMC free article] [PubMed] [Google Scholar]
Associated Data
This section collects any data citations, data availability statements, or supplementary materials included in this article.