
Figure 2.
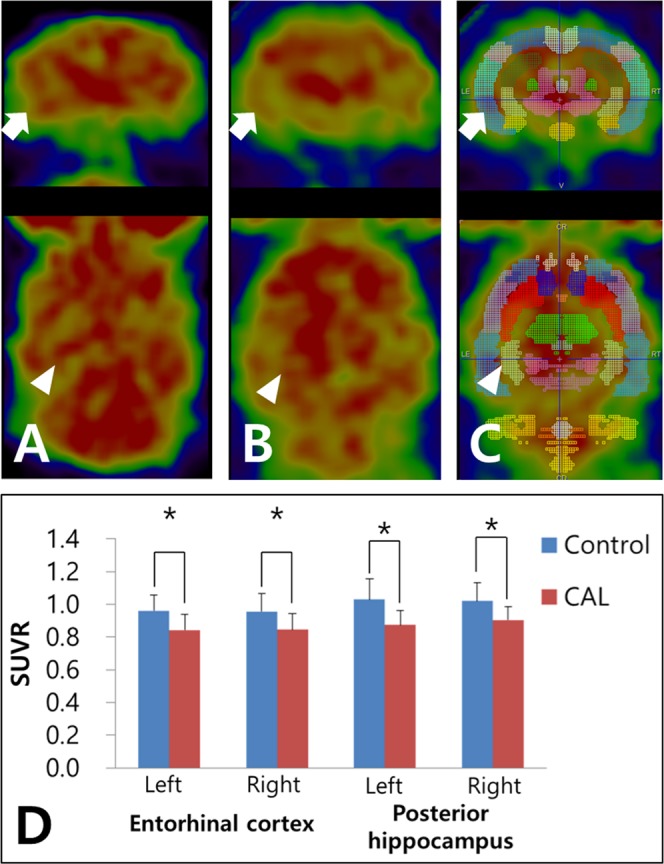
Cerebral glucose metabolism measured by F-18 FDG PET. (A) A sham-operated rat (control group) showing no abnormal glucose metabolism of the entorhinal cortex (arrow) and posterior hippocampus (arrowhead). (B) A rat with bilateral common carotid artery ligation (CAL group) showing a decreased glucose metabolism of the entorhinal cortex and posterior hippocampus. (C) Regional standardized F-18 FDG uptake values (SUVRs) obtained from the W. Schiffer rat brain volume-of-interests using the PMOD software package (see Methods). (D) The regional SUVR of the left entorhinal cortex and bilateral posterior hippocampus in the CAL group are significantly lower than those in the control group. Asterisks indicate statistical significance: *p < 0.05.