
Figure 6.
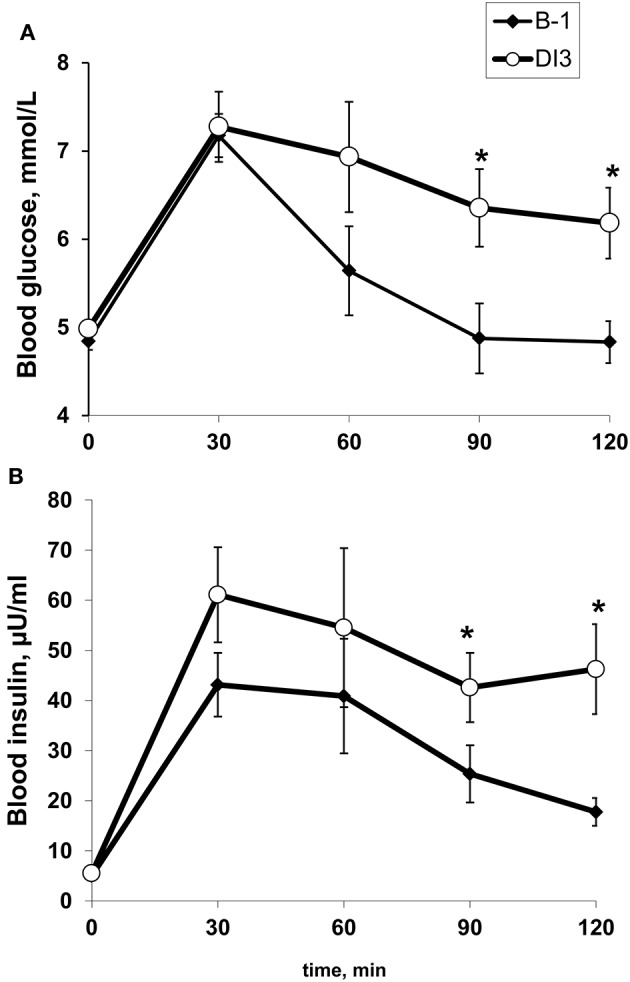
The effect of 48-h dry immersion on the glucose (A) and insulin (B) response to 75-g oral glucose tolerance test in 12 healthy subjects. Data are mean ± SEM. *p ≤ 0.05 vs. B-1.
Official websites use .gov
A
.gov website belongs to an official
government organization in the United States.
Secure .gov websites use HTTPS
A lock (
) or https:// means you've safely
connected to the .gov website. Share sensitive
information only on official, secure websites.
The effect of 48-h dry immersion on the glucose (A) and insulin (B) response to 75-g oral glucose tolerance test in 12 healthy subjects. Data are mean ± SEM. *p ≤ 0.05 vs. B-1.