

Abstract
Accumulating data suggest that metastatic dissemination often occurs early during tumour formation but the mechanisms of early metastatic spread have not yet been addressed. Here, we studied metastasis in a HER2-driven mouse breast cancer model and found that progesterone-induced signalling triggered migration of cancer cells from early lesions shortly after HER2 activation, but promoted proliferation in advanced primary tumour cells. The switch from migration to proliferation was regulated by elevated HER2 expression and increased tumour cell density involving miRNA-mediated progesterone receptor (PGR) down-regulation and was reversible. Cells from early, low-density lesions displayed more stemness features than cells from dense, advanced tumours, migrated more and founded more metastases. Strikingly, we found that at least 80% of metastases were derived from early disseminated cancer cells (DCC). Karyotypic and phenotypic analysis of human disseminated cancer cells and primary tumours corroborated the relevance of these findings for human metastatic dissemination.
Introduction
Systemic cancer (the dissemination and subsequent distant outgrowth of cells from a solid tumour) occurs in two phases: a clinically latent stage of hidden cancer spread and then manifest metastasis. Manifest metastasis remains mostly incurable. Clinically undetectable minimal residual disease (MRD), defined by disseminated cancer cells (DCCs) that are left behind after primary tumour (PT) surgery, offers a time-window to prevent metastasis1,2. However, only circumstantial knowledge is available about MRD and systemic (adjuvant) therapies consequently improve outcome in only about 20% of patients3,4. This situation indicates that our current understanding of early systemic cancer is insufficient to prevent metastasis.
The first direct evidence for a characteristic biology of early-disseminated cancer and MRD came from analyses of disseminated cancer cells (DCCs) isolated from bone marrow of breast cancer patients before (M0 stage) and after (M1 stage) manifestation of metastasis5,6, indicating that M0-DCCs might have disseminated early and evolved in parallel with the primary tumour7. Studies in transgenic mouse models8–10 and in patients with pre-malignant lesions or in situ carcinomas8,11,12 corroborated this concept but the relevance of DCCs remains hotly contested13.
We therefore addressed the issue of breast cancer cell dissemination soon after cancer initiation and asked whether mechanisms exist that reduce metastatic seeding from advanced cancer. Finally, we addressed whether early DCCs are able to form metastases. We report a mechanism involving cell density, HER2 and progesterone signalling that reconciles early and late dissemination models.
Results
Progesterone and HER2 signalling regulate gene expression in early mammary lesions
In Balb-NeuT mice, dissemination starts shortly after expression of the Her2-transgene at puberty (around week 4), when first hyperplastic lesions become apparent8. From weeks 4–9 we observed micro-invasion8, and a sharp decline in the ratio of DCCs to total tumour area (a measure of cell numbers at risk to disseminate) during primary tumour growth (Extended Data Fig 1a). The genetic program governing dissemination from early lesions (ELs) in microdissected tissue samples (Extended Data Fig 1b and Supplementary Table 1) revealed signature gene expression profiles compared to healthy mammary glands, primary tumours (PT) and lung metastases (Figure 1a). We defined 1278 gene transcripts unique to ELs of which 300 were highly conserved between mouse and human (Supplementary File 1).
Figure 1. Identification of a gene expression signature linked to early dissemination.

(a) Heatmaps of genes differentially expressed between different sample types: normal mammary glands from BALB/c, early lesions (EL), primary tumours (PT) and metastases (MET) from Balb-NeuT mice; yellow, upregulation; blue, downregulation. (b) Five-gene surrogate signature (qPCR) for EL profile. (c) Progesterone (P) activates EL-signature in vitro (t-test; Mean ±SD). (d) TissueFAX cytometric quantification of HER2 and PGR protein expression. Mean HER2 staining intensity (red line, left histograms) in arbitrary units and percentage of PGR+ cells (right histogram) and box plots (One-way ANOVA). **, p≤0.01; ****, p≤0.0001.
We confirmed differential expression of selected transcripts by qPCR (Extended Data Fig 1c) and checked transcript expression of steroid hormone receptors (strong candidate regulators; Supplementary Tables 2–3), all of which, except Er-α, were highest in EL (Extended Data Fig 1d). Using Ahnak, Baz2a, Nfatc3, Nr3c1, and Nr3c2, as surrogate markers of the EL signature (Figure 1b; Supplementary Tables 2–3; Supplementary File 1), progesterone was the only steroid hormone that recapitulated their expression (Extended Data Fig 1e), but only in EL cells of 9-week old Balb-NeuT mice, and not in wild-type mammary or PT cells (Figure 1c). Moreover, expression of PGR-B, the main isoform for mammary gland development14–16, correlated with low-moderate HER2 in EL and wild-type mammary tissue (Extended Data Fig 1f). We therefore quantified HER2 and PGR protein expression in mammary cells displaying normal, hyperplastic or advanced tumour morphology. The number and staining intensity of HER2+ cells steadily increased with EL lesions presenting intermediate numbers and expression levels. PGR staining intensity was constant, but the PGR+ cell number declined from 40% (normal gland) to zero in primary tumours (Figure 1d).
The EL-signature could be activated in 4T1, an MMTV-HER2-negative tumorigenic cell line (Extended Data Fig 1g) displaying weak endogenous HER2 expression (Extended Data Fig 1h). Furthermore, HER2-negative cells (67NR and MM3MG) did not express the EL signature (Extended Data Fig 1g), but progesterone treatment or transduction of Pgr-B up-regulated HER2 in 4T1 and MM3MG cells, respectively (Extended Data Fig 1h–i). Collectively, these results suggested that the genetic program of ELs depends on the combined activation of progesterone and HER2 pathways.
Progesterone induces migration and stemness of EL- but not of PT cells
Since progesterone mediates branching14 in mammary gland development we explored the role of the progesterone-induced EL signature for cancer cell migration. We found the mRNA of the progesterone-induced paracrine signals (PIPS) Rankl and Wnt4 up-regulated in EL samples (Extended Data Fig 2a). Treatment of EL-derived cells with PIPS mimicked the effect of progesterone (Extended Data Fig 2b), suggesting that ELs exploit the mechanisms of mammary branching for metastasis. Consistent with this, PGR+ cells were enriched in anterior ducts of normal mammary glands (advancing the branching tree away from the nipple during developmental fat pad invasion) compared to posterior ducts closer to the lymph node (more differentiated ducts; Extended Data Fig 2c–d).
Furthermore, progesterone and PIPS induced migration of mammary cells from EL-derived samples (freshly prepared or mammospheres thereof) and suppressed it in cells from primary tumours (Figure 2a and Extended Data Fig 2e–f).
Figure 2. Progesterone induces migration and sphere formation of EL cells.

(a) EL and PT cells respond to progesterone or PIPS (WNT4, RANKL) with activation (EL) or suppression of migration (PT). (b) Mammosphere-formation depends on age and HER2 expression. (c) EL and PT cells respond to progesterone or PIPS with activation (EL) or suppression of sphere formation (PT). (d) Depletion of PIPS by IWP-2 (WNT inhibitor) or anti-RANKL (neutralizing antibody) reduces migration and sphere formation of EL cells. (e) PIPS-activated migrating cells form spheres (See also Extended Data Fig 2g). All p-values, Student’s t-test; *, p≤0.05; **, p≤0.01; ***, p≤0.001; ****, p≤0.0001; error bars depict Mean ±SD.
PIPS also activate mammary stem cells (MaSCs) during mammary gland development17, prompting us to test mammosphere formation18. Consistent with previous reports on HER2-stimulated stemness19,20 Balb-NeuT-derived samples generated significantly higher numbers of spheres than controls (Figure 2b). Unexpectedly, mammary cells derived from young (week 4–9) mice generated more spheres than primary tumour cells (Figure 2b). Furthermore, EL-derived cells generated higher sphere numbers in response to progesterone and PIPS than primary tumour samples (p≤0.001; Figure 2c). Neutralizing antibodies against RANKL and a WNT inhibitor abrogated the effect of progesterone on EL migration and sphere-formation (Figure 2d).
Migrating EL cells (i.e. those arriving on the other side of the membrane) formed increased sphere numbers in response to progesterone (Fig 2e and Extended Data Fig 2g). Estrogen also induced migration and sphere formation, however the progesterone inhibitor, RU486 inhibited this pro-migratory and pro-sphere forming effect (Extended Data Fig 2h), possibly because estrogen acts via transcriptional induction of Pgr21. Together, these results suggested that moderate HER2 expression with progesterone or PIPS availability promote sphere-formation and migratory responses upon mammary epithelial cells.
HER2 expression levels determine migratory vs proliferative cellular responses
We next performed a series of mechanistic in vitro experiments using mouse mammary epithelial MM3MG cells (ERα-negative but faintly expressing PGR and HER2). MM3MG cells transduced with Pgr-B or Her2 were subjected to sphere formation and migration assays (Extended Data Fig 3 and described in the supplementary legend) confirmed that PIPS-responsive cells (migration and sphere formation) were HER2low/PGR−, whereas HER2high cells mimicked non-migrating primary tumour cells (enhanced proliferation).
Cell density regulates HER2 and PGR expression and migratory and proliferative phenotypes
Surprisingly, individual PT-derived cells re-expressed Pgr mRNA and protein when cultured under low cellular density (Extended data Fig 4a–b). We therefore plated the PT-derived Balb-NeuT TUBO cell line at different cell densities and found PGR expression in 10±5% of cells grown at low-density, but undetectable PGR expression at high density (Figure 3a). Several experiments suggested a soluble PGR-suppressing activity exclusively within the vesicular fraction of cell culture supernatants and conserved between mouse and humans (Extended data Fig 4b–e). To identify this activity, we analyzed the miRNA profiles of exosomes and exosome-free supernatants of TUBO cells, and the HER2-overexpressing cell line MM3MG-Her2. miRNA sequencing (Supplementary File 2) and bioinformatic prediction of Pgr regulators (Extended data Fig 4f) identified miR-30a-5p and miR-9-5p as abundantly expressed in TUBO cells and able to down-regulate Pgr in T47D cells (Extended data Fig 4g–h). miR-30a-5p was up-regulated by HER2 (Extended data Fig 4f and i) and miR-9-5p expression sensitive to cell density (Figure 3b–c).
Figure 3. Cell density regulates PgR expression and EL phenotype.

(a) TUBO cells re-express PGR at low cell density. (b) TUBO cells grown at high density up-regulate miR-9-5p. (c) Expression of miR-9-5p in early lesion (EL) and primary tumour (PT) samples. (d) PT and TUBO cells generate the EL-signature only when grown at low density. (e) Migration and sphere-formation of four human cell lines grown at low and high densities and treated with PIPS (WNT4+RANKL) or progesterone (See also Extended Data Fig 5; error bars are Mean ± SD). (f) Number of lung macro-metastases after tumour formation from transplanted tumour pieces (1 mm3; high density) or 50 spheres in 40 μl matrigel (low density) and PT surgery (Mann-Whitney test; median). (g) Mechanisms of local tumour and distant metastasis formation as derived from in vitro and in vivo (see Fig 4) data. *, p≤0.05; ***, p≤0.001.
Low cell density induced EL-like features (such as EL signature induction, reduced HER2 expression, migration, and sphere formation) in PT-derived cells from the Balb-NeuT model (Fig 3d and Extended Data Fig 4j–m). Interestingly, several human cell lines shared density regulation of HER2 and Pgr-regulating miRNAs (Extended Data Fig 5a–d). Moreover, we observed density regulation of migration and sphere formation in 10/10 tested human breast cancer cell lines (7/10 by PIPS and 3/10 by progesterone induction; Figure 3e and Extended Data Fig 5e).
To assess the contribution of cell density in vivo, we compared metastasis formation of transplanted primary tumour pieces (very high cell density) vs. PT spheres (50 spheres injected in 40 μl matrigel, i.e. very low density). After primary tumour formation we performed curative surgery and evaluated metastasis-formation. No difference was found for the percentage of mice with metastases, however the sphere model generated a higher number of metastases (p≤0.05; Figure 3f). In summary, we obtained strong support for a model of metastatic dissemination regulated by cell density, HER2 expression and progesterone signalling (Figure 3g).
Progesterone signalling regulates tumour formation and dissemination in vivo
To validate these findings, we recapitulated physiological conditions of reduced (higher age; Extended Data Fig 6a–b, Fig 1d and Extended Data Fig 2a) and increased (pregnancy) PGR signalling as experimental settings. We transplanted spheres generated from EL and PT samples into young (week 4; PGR-rich) and old (week 40; PGR-reduced) wildtype (wt) recipients. All mice were sacrificed when the first mice developed tumours of 5–10 mm diameter (8 weeks later). Most PT-transplanted mice formed palpable tumours, but none of EL transplanted mice (Figure 4a), which nevertheless harboured microscopic EL/DCIS lesions (Extended Data Fig 6c–d). Interestingly, EL-sphere-transplantation increased animal numbers harbouring DCCs, and resulted in higher numbers of DCCs in bone marrow (BM) than PT-sphere-transplantation (Figure 4b–c).
Figure 4. Progesterone signalling regulates tumour formation and dissemination in vivo.

(a) Tumour formation 8 weeks after transplantation of PT- or EL-derived spheres into mammary fat pads of wt-BALB/c siblings. (b) Percentage of mice with DCCs (detected by cytokeratin staining) in bone marrow (BM) 8 weeks after transplantation. (c) Number of DCCs in BM of mice 8 weeks after transplantation. (d) DCC counts in BM in recipients transplanted at different age. (e) Time to tumour formation after transplantation of mammary glands (week 4; gland model) or tumour pieces (week 20–22; tumour model). The red box highlights mice from both models with similar tumour growth kinetics, which are analysed separately in Extended Data Fig 6o–q. (f) Percentage of mice with lung macro-metastasis in gland vs. PT model. (g) Macro-metastasis formation in recipient mice with similar tumour growth kinetics (mice enclosed in red box of panel e; see Extended data Fig 6o). (h) Example of a phylogenetic tree (mouse 3769): N, normal cells; P, primary tumour; M1-3, metastases 1–3; A1-3, inferred common ancestors. The ordinate indicates the number of aberrations per profile on a square root scale. (i) Aberration profiles along tree paths from N via A1-3 to P or M1-3 in terms of aberration prototypes (see Extended data Fig 7–9 for details). (j) Distribution of relative “time points” of dissemination on a genetic scale for all 44 primary tumour-metastases pairs. The red line indicates dissemination after which 50% of primary tumour changes were acquired as an arbitrary threshold for early vs late dissemination; see Extended Data Fig 7c). P-values in panel a, c, and d: Student’s t-test; in b,: Fisher’s exact test; in f and g: chi square test; in e: Mann-Whitney test. *, p≤0.05; ***, p≤0.001; ****, p≤0.0001; NS, Not Significant. Panels a, c, d, and e represent medians.
We noted suppressed dissemination and stimulated tumour formation from PT spheres in the PGR-rich microenvironment of young mammary glands (Figure 4d and Extended Data Fig 6e) as expected. Surprisingly, dissemination from ELs was not reduced in old recipients (Figure 4d). However, the transplanted EL generated a PGR-rich microenvironment in old recipients (Extended Data Fig 6d), consistent with the observation that EL, but not PT, cells could generate PGR-positive cells in 3D culture (Extended Data Fig 6f–g). Co-transplantation of Balb-NeuT PT-spheres with MM3MG-Pgr-B into 40 week-old mice resulted in the expected reduction of dissemination and stimulation of tumour formation (Extended Data Fig 6h–i).
Since progesterone levels are physiologically elevated 10- to 20-fold during pregnancy, we mated female transgenic mice at EL (week 7) and at early tumour formation (week 15). Mice were sacrificed at term, and those mated at EL displayed higher numbers of DCCs (Extended Data Fig 6j); those mated at week 15 formed large tumours within 3 weeks, faster than controls (Extended Data Fig 6k).
To assess metastasis from EL and PT lesions, we transplanted pieces from mammary glands (gland model) of 4–5 week-old transgenic mice or from PTs (PT model) into the cleared mammary fat pad of 4 week-old wt recipients (Extended Data Fig 6l–m). Tumour growth to 5–10 mm was fast for PT pieces (indicating their high viability) and took longer in the gland model (Figure 4e). After surgery (Extended Data Fig 6l–m), more mice displayed metastasis in the gland model (Figure 4f; p<0.0001), although numbers of metastatic foci were similar in both cases (Extended Data Fig 6n). Since the slower growth of EL until surgery might have extended the available time for metastasis formation, assuming dissemination occurred early, we restricted our analysis to mice with similar kinetics of primary tumour growth (red box in figure 4e; Extended Data Fig 6o). Again, more mice developed lung metastases in the gland model (Figure 4g), although in this subgroup analysis the post-operative time was significantly longer for mice of the PT model (Extended Data Fig 6p). The number of metastases was similar (Extended Data Fig 6q). Together, the in vivo results are in line with in vitro findings that PIPS induces migration and sphere-formation of EL cells and proliferation of advanced PT cells.
We used the gland model to determine which metastases were derived from early rather than late DCCs and performed phylogenetic analyses of 28 primary tumours with 1 or more lung metastases of the same mouse. Phylogenetic trees were generated from copy number alterations (CNA), since Balb-NeuT tumours rarely display point mutations similar to human breast cancer22. Total CNA numbers were indistinguishable between primary tumours and metastases (Extended Data Fig 7a) and no individual change was significantly associated with primary tumour or metastasis origin (Extended data Figure 7b). This suggested that aberrations shared between primary tumours and metastases were acquired earlier, indicating the time of genetic divergence (Figure 4h–i). In all cases we observed branching evolution with one (single metastasis) or several ancestors (multiple metastases; Figure 4i and Extended Data Fig 7–9). To assign splits between primary tumours and metastases as early or late, we assessed the proportion of primary tumour alterations that were already present in the latest ancestor. In linear progression, this value would be 1 (the primary tumour had acquired all mutations before the metastatic precursor left the site), but we employed the very conservative threshold of ≥0.5 for late dissemination. Absolutely, totally and utterly amazingly, we found that for 35 of 44 individual primary tumour – metastasis pairs (79.5%) lung metastases were derived from early DCCs that disseminated before the primary tumour had acquired 50% of its alterations (Figure 4j).
HER2 and PGR cooperation in human metastatic dissemination
The mechanisms of breast cancer dissemination described above cannot be studied directly in patients as the event occurs before diagnosis. We therefore checked if human breast cancers also seed relatively fewer BM-DCCs (detected by cytokeratin staining23) with growing PT size as seen for the Balb-NeuT model (Extended Data Fig 1a). Indeed, the percentage of DCC-positive patients or DCC numbers in BM of 2239 breast cancer patients were not linked to tumour diameter (Figure 5a). We then asked if DCC numbers are associated with HER2 and PGR expression and categorized primary tumours for expression of PGR and HER2 status (Supplementary Table 4). Strikingly, in breast cancers with high PGR score, genetic activation of HER2 increased the dissemination rate (p≤0.05; Figure 5b), akin to EL lesions in the Balb-NeuT model. This subgroup of patients (HER2amp/PGRhigh) comprised 3.7% of all patients (85/2239) or 24.6% of HER2-amplified tumours (85/345). HER2amp/PGRhigh (Supplementary Table 5) primary tumours contained HER2 and PGR single- and double-positive and double-negative cells (Extended Data Fig 10a). Areas of high cell density lacked PGR expression and invasive regions of lower density harboured strongly double-positive cells (Figure 5c), suggesting density-mediated Pgr regulation within the same samples. We therefore checked the expression of Balb-NeuT mouse Pgr-regulatory miRNAs (Supplementary Table 6). Indeed, HER2amp/PGRhigh tumours displayed lower levels of Pgr down-regulating miRNAs compared to HER2amp/PGRneg tumours (Figure 5d), similar to HER2high/PGRhigh cell lines BT474 and T47D (Extended Data Fig 5a–b). PgR-negative, high-density regions in HER2amp/PGRhigh samples (See Figure 5c) displayed strong Pgr-regulating miRNA over-expression (Extended Data Fig 10b).
Figure 5. PGR, HER2 signalling, and dissemination in breast cancer patients.

(a) An increase in tumour diameter is not accompanied by an increase of DCCs in bone marrow. (b) PGR and HER2 expression identifies a HER2high/PGRhigh subgroup of patients with highest seeding rates. (c) Comparison of HER2high/PGRhigh human breast cancers and primary Balb-NeuT mouse tumours for HER2/PGR staining: (A–B) EL (A) and PT (B) from Balb-NeuT model. (C–D) High-density regions (strong HER2 and low PGR expression, black arrows) and regions of invasive cells (strong PGR and HER2 expression, blue arrows). (d) PGR-downregulating miRNAs are repressed in HER2high/PGRhigh human mammary carcinomas. (e) Copy number alterations in human primary breast cancers (from progenetix database) and DCCs isolated from bone marrow of breast cancer patients with and without metastasis (M0: n=94; M1: n=91). The y-axis depicts the percentage of samples with aberrations (green = gain; red = loss) for each chromosomal region. (f) Oestrogen receptor (ESR1) and progesterone receptor (PGR) transcript expression in human breast cancer DCCs (10/26 DCCs from 19 M0 patients are shown; see Supplementary Table 8). ACTb, EEF1a1, GAPDH: controls for sample quality. BT474 single cells: positive control. P-values in a, b: chi-square test; in d: Mann-Whitney test ; *, p≤0.05; **, p≤0.01; NS, Not Significant.
DCCs from breast cancer patients without metastasis (UICC stage M0; n=94 cells; Supplementary Table 7) and of patients with metastasis (UICC stage M1; n=91 cells) were compared to primary breast cancers (n=1637) from a large database24. Comparative genome hybridization (CGH) profiles of primary tumours were strikingly similar to those of single DCCs isolated from M1-stage patients (Figure 5e). In contrast, single DCCs from M0-stage patients, while displaying clearly aberrant profiles, lacked gains and losses characteristic of primary tumours, such as 8p loss or 8q gain (Figure 5e). Thus, (i) DCCs often disseminate before the acquisition of typical breast cancer CNAs; (ii) tumour cells displaying the typical karyotype of established tumours are rarely found at M0-stage disease in bone marrow; (iii) DCCs displaying M1-like genomes must replace DCCs with M0-like genomes to generate metastatic disease, although the primary tumour was surgically removed.
Finally, we tested whether human DCCs (n=26) isolated from BM of 18 luminal and one triple-negative breast cancer patients (Supplementary Table 8) lacked PGR expression as predicted from the Balb-NeuT model. We identified and profiled DCCs by combined genome and transcriptome analyses of single cells25. None of the 26 DCCs displaying genomic aberrations expressed PGR (Fig 5f). Interestingly, the only DCC expressing HER2 transcripts originated from one of two patients diagnosed with DCIS only.
Discussion
This work provides strong evidence that murine and human mammary cancer cells migrate and disseminate from morphologically very early lesions. The mechanism, which is shut down as primary tumours grow and overt lesions develop, consists of three major players: cell density, PGR and HER2 signalling. While the specific molecular details are more likely to be tissue dependent than universal, our proposed mechanism may provide a general framework model for the understanding of metastasis with cancer cells undergoing a switch from dissemination- to proliferation-mode (Figure 3g).
Our findings challenge the concept that late-disseminating (ie shortly before surgery), fully mature cancer cells necessarily have a higher ability to form metastases13. Indeed our genetic analyses revealed that 80% of metastases in Balb-NeuT mice are derived from early DCCs. The genomic profiles of human DCCs isolated intraoperatively months to years before metastasis represented early cancer cells, not the predominant PT clones, indicating that early DCCs have yet to acquire critical alterations such as 8q gains to form metastases. The time to acquire such changes may largely account for the long latency periods and late relapses, which are becoming clinically more and more relevant26. Therefore, parallel progression7 seems to be typical rather than exceptional. This is strongly supported by a recent sequencing study, where not a single case of linear progression from primary tumour to metastasis was found27.
Our data indicate that breast cancer hijacks a developmental program, where progesterone and its paracrine signals regulate mammary epithelial branching, fat pad invasion14,28,29 and MaSC expansion14,17,18,30–32 during development and pregnancy, for dissemination independently of breast cancer subtype. Relevance to human disease is highlighted by a careful analysis of mortality from DCIS, hitherto defined as pre-invasive lesion33. Of the 3% of DCIS fatalities, more than 50% die of metastasis without local relapse, indicating lethal dissemination before surgery of the “pre-invasive” lesion33. Evidently, dissemination will also occur early if the tumour is not diagnosed as DCIS but later as invasive cancer. Moreover, death from DCIS increased significantly to 8% for young women33, possibly because in young women the epithelial compartment and the microenvironment have high PGR-expression.
The gradual generation of HER2high/PGR− phenotype may explain why early lesions of the Balb-NeuT model, but not advanced tumours, were found to represent human luminal tumours34. The Balb-NeuT model apparently represents a mixed luminal and HER2 phenotype and models several breast cancer subtypes. Cell density, progesterone, PIPS and HER2 signalling regulated dissemination and sphere formation in breast cancer cell lines of all subtypes similar to the Balb-NeuT model. Interestingly, HER2-positive CTCs were detected in DCIS/LCIS or M0-stage breast cancer patients irrespective of the primary tumour HER2 status35.
High cell density and HER2 expression were responsible for the proliferative switch of mammary epithelial cells. Strongly oncogenic mutations characterize benign tumours that do not metastasize36–38; indeed, strong activation of oncogenic pathways represses metastasis while increasing proliferation39,40. However, our experiments do not exclude the possibility that metastases form from advanced tumours because the EL dissemination program may become re-activated in areas of low cell density.
Our findings have immediate implications for the understanding of metastasis and development of therapies: systemically spread cancer cells likely comprise cells derived from different stages of primary tumour evolution, including the earliest. Since DCCs from early and later stages have metastatic potential, therapies targeting the seed of metastasis need to address this heterogeneity.
Methods
Mice
Balb-NeuT transgenic mice were obtained through collaboration with Dr. Guido Forni and maintained in our facilities according to the European Union guidelines. All animal experiments were performed according to the EU and national institutional regulations. Mice were screened at 3 to 4 weeks of age for hemizygosity (neuT+/neuT‒), and negative littermates served as wild-type BALB/c mice controls. Mammary glands of Balb-NeuT female mice were inspected twice a week and arising tumours were measured in two perpendicular diameters. Data acquisition for BM DCCs was performed in a blinded manner, whereas enumeration of lung metastasis was performed unblinded by two observers. All experimental animal procedures were approved and conducted according to German federal and state regulations (Government of Upper Palatinate, 55.2-2532.1-27/14).
Surgery and transplantation experiments
Mice were anaesthetized with Midazolam 5 mg/kg, Fentanyl 0.05 mg/kg, Medetomidin 0.5 mg/kg i.p. Thorax and abdomen were shaved, skin was incised from caudal to cranial in the midline. Fifty spheres were mixed with matrigel (BD Biosciences: 356231, Germany; final concentration was 40%) and injected into the fourth right mammary gland of BALB/c mice (4 and 40-week-old). For tissue transplantation, a piece (approximately 1 mm3) of donor mammary tissue from 4-week-old Balb-NeuT mice (gland model) or PT (PT model) was implanted in the “cleared” mammary fat pad of recipient mice (4-week-old BALB/c). The skin was closed by a suture using polygelatin string (Ethicon, Germany) and anesthesia was antagonized with Flumazenil 0.5 mg/kg, Atipamezol 2.5 mg/kg, Naloxon 1.2 mg/kg s.c.. Postoperative analgesia was achieved by Buprenorphin (0.1 mg/kg) s.c.. Curative surgery or dissection was done when the diameter of tumours was between 5–10 mm. After surgery, mice were kept until we observed first general signs of reduced health. After dissection, lungs were macroscopically inspected and individual metastases counted.
Extent of dissemination relative to tumour area
Data were taken from reference8. Briefly, gland/tumour areas were calculated from 270 mammary glands/tumours of 27 mice assuming the shape of an ellipse/circle for each tumour. The tumour area of mammary glands without palpable (i.e. not measurable by a caliper) tumours was set to 0.1 mm2 (i.e. assuming a diameter of 350 μm of a total, circular hyperplastic lesion within a mammary gland) for lesions from week 4 to week 9 old mice and 0.4 mm2 for week 11 mice. The adjustment for week 11 was based on a microscopic evaluation revealing an about four-fold increase in hyperplastic lesions. Dissemination to bone marrow was determined by the number of cytokeratin-positive cells per 106 BM cells (Extended Data Fig 1a).
Murine bone marrow preparation and staining for DCCs
Bone marrow was harvested from femurs and tibiae. The bone marrow was rinsed with a 26-G needle with 1 ml of PBS. After density gradient centrifugation, 5 × 10⁵ interphase cells were put on adhesion slides (Menzel, Germany). At least 106 cells per mouse were stained to detect positive cells. Blocking solution (5% rabbit serum in 1× TBS) was added to the slides to rehydrate the cells and to block unspecific binding of antibodies to the cells. After 20 min the blocking solution was discarded and primary antibody against CK 8 and 18 (all antibodies and working concentrations are in Supplementary Table 9) or guinea pig serum (CK antibody originated from guinea pig) as control, was added and incubated for 60 min. The primary antibody was discarded and the slides were washed 3 times for 3 min in 1× TBS. The slides were incubated with the secondary antibody for 25 min, and then washed 3 times for 3 min in 1× TBS followed by incubation with ABC complex for 25 min. Finally, the development system of the BCIP/NBT (AP Conjugate Substrate Kit; Bio-Rad Laboratories GmbH: 1706432, Levamisol hydrochloride; Sigma Aldrich GmbH: L-9756) for alkaline phosphatase enzymatic substrate was added for 10 min. The slides were washed 3 times for 3 min and screened for CK8/18 positive cells. The positive cells were typically violet-to-black in colour. TUBO, a tumour cell line derived from a murine primary mammary tumour of BALB-NeuT and known to express CK8/18, was used as a positive control.
Laser Microdissection and microarray analysis
Laser microdissection (PALM MicroBeam from Carl Zeiss MicroImaging GmbH) was performed to dissect metastatic lesions from lungs, primary tumours, and epithelial layers of mammary glands of Balb-NeuT mice at the time point of EL (7–9 week; examples are shown in Extended Data Fig 1b), and BALB/c mice at different age (description of samples is given in Supplementary Table 1). Small pieces summing up to 100,000 μm2 for each sample were catapulted into a cap with 10 μl paramagnetic biotinylated oligo-dT peptide nucleic acids bead suspension and lysis buffer. Extraction of mRNA and microarray experiments were performed as described previously41. Heatmaps in Fig 1a were generated using Euclidean distance and complete linkage agglomerative clustering on row (gene)-wise standardized expression data (zero mean, unit standard deviation).
Cell lines, cell culture and cell stimulation
Breast cancer cell lines (4T1, 66cl4, and 67NR) were kindly provided by Dr. Fred Miller (Karmanos Cancer Institute, Detroit, MI). These cell lines are derived from a single mammary tumour that arose spontaneously in a wild type BALB/cfC3H mouse. The MM3MG mouse mammary epithelial cell line derived from BALB/c background was purchased from ATCC Company (ATCC® CRL6376™). The TUBO cell line is a cloned cell line established in vitro from a lobular carcinoma that arose spontaneously in a BALB-NeuT mouse (a gift from Dr. Guido Forni, Department of Clinical and Biological Science, University of Turin, Italy). All murine and stably transduced cell lines were grown in DMEM medium (Pan-Biotech: P04-03500) supplemented with 10% (20% for TUBO cell line) FCS (Pan-Biotech: P30-3702), 2 mmol/L L-glutamine (Pan-Biotech: P04-80100), 10 unit/ml penicillin/streptomycin (Pan-Biotech: P06-07050). All human cell lines were purchased from ATCC and each cell line was maintained in the medium as recommended by ATCC. The origin of the cell lines was confirmed by short tandem repeat (STR) analysis (Cell-ID™, Promega). All cells were incubated at 37°C with 5% CO2. Steroid hormones (progesterone, aldosterone, β-estradiol, testosterone, and hydrocortisone; all from Sigma Aldrich) and RU486 (Sigma Aldrich) were dissolved in ethanol. RANKL (murine Rankl: Abcam, ab151200 and human RANKL: Abcam, ab9958), WNT4 (murine WNT4: R&D systems, 475-WN and human WNT4: Abnova, H00054361-P01), Lapatinib (Santa Cruz Biotechnology: SC202205), IWP-2 (Sigma Aldrich: I0536), RANKL neutralizing antibody (Lifespan Biotech: LS-C150261) were dissolved according to the manufacturer’s instructions. All cell lines were routinely tested for mycoplasma and were found to be negative.
Primary cultures and sphere formation assay
Fresh mammary gland or primary tumours were digested with 200 units/ml collagenase I (Worthington biotech: LS004196) and 1 μg/ml hyaluronidase (Sigma: 4272) in basal medium for 2h at 37°C. The basal medium ingredients were DMEM/F12 (PAN biotech: P04-41450) supplemented with 10 mM HEPES buffer (Sigma: H0887), penicillin/streptomycin (Pan Biotech: P1-010) and 10 μg/ml insulin (Sigma: I9278). Digested tissue cells were centrifuged and re-suspended in basal medium. The cells were subsequently cultured (i) in a density of 5 × 10⁴ cells/ml in ultra- low adherent plates coated with 1.2% poly-HEMA (Sigma: P3932); (ii) in a density of 2.6 × 10⁴ cells/cm2 for adherent culture in DMEM medium (Pan-Biotech: P04-03500) supplemented with 10% FCS (Pan-Biotech: P30-3702), 2 mmol/L L-glutamine (Pan-Biotech: P04-80100), 10 unit/ml penicillin/streptomycin (Pan-Biotech: P06-07050). Sphere culture medium was basal medium supplemented with 2% B27 (Gibco: 17504044), 10 μg/ml EGF (Sigma: E9644), 10 ng/ml bFGF (Sigma: F0291), 20 ng/ml hIL6 (a gift of Dr. Stefan Rose-John Christian-Albrechts-University, Kiel, Germany), 4 ng/ml heparin (Sigma: H3149), 5 ng/ml GRO-α (R&D systems: 275-GR). Concentrations of activators/inhibitors etc. are given in the main text, figures or legends. Sphere cultures were incubated at 37°C with 5% CO2 and 7% O2 and spheres were screened after 10 days. Only spheres with a diameter > 50 μm were counted. The size of mammospheres was inspected under light microscope and measured using Zeiss Axiovision software (Carl Zeiss, Jena, Germany) after 10 days.
Cell density experiments
TUBO cells were cultured in 3 × 10⁴ cells/cm2 for high density and 5.2 × 10³ cells/cm2 for low-density experiments. PT primary cells were cultured in 10.6 × 10⁴ cells/cm2 for high-density and 2.2 × 10³ cells/cm2 for low-density experiments. Criteria for human cell lines was 100% confluency for high density and 20–30% confluency for low-density. For hormone treatment and comparisons between low and high-density experiments, cells were incubated for 76 h and fresh hormone treatment and washed (2× with PBS) in 24 h intervals. We avoided changing medium and washing steps during incubation of cells for miRNA analyses. In migration experiments we seeded 104 cell/well (24 well migration chambers) for low-density of all cell lines and 5 × 10⁴ cell/well for high-density of TUBO cells and 4 × 10⁴ for the other cell lines.
Transwell assay
Transwell inserts (Corning: 3419) with a microporous membrane of 0.4 μm were used to separate the upper (UC) and lower compartments (LC). The microporous membrane allows only soluble factors to pass through between the compartments. EL cells were cultured in the lower chamber and PT cells were cultured in the upper chamber. Both were cultured in a density of 106 cells per well of 6 well plates (DMEM 10% FCS).
Migration/Invasion-sphere formation assays
Transwell inserts (Corning: 3422) with 8 μm pores were coated with 30% matrigel. Forty thousand cells from cell lines and 105 cells isolated from tissue or dissociated spheres were resuspended in FCS-free medium before seeding. Cells were then seeded in 200 μl of FCS-free medium (DMEM) on the top of the matrigel layer and FCS medium (DMEM) was added to the lower chamber. For additional treatments both upper and lower media were supplemented with the reagents at concentrations as specified in the text and figures. After incubating cells isolated from mammospheres or from freshly digested tissues for 72 hours, inserts were removed and cells were fixed with methanol (−20°C for 10 min) and stained with trypan blue. Cells were counted from 3 fields (4× magnification) when visualized under the microscope.
For the combined migration/sphere formation assay cells were placed on a layer of 30% matrigel in the upper chamber and the lower chamber was coated with poly-HEMA. The mammosphere medium used is described above. After 72 hours, inserts were removed, fixed and stained with trypan blue for single cell migration analysis. Six hundred microliters of fresh sphere medium was added to the lower chamber and cells were incubated for 11 days when spheres were counted (Fig 2e and Extended Data Fig 2g).
Proliferation assay
Single cell suspensions were cultured in 96 well plates (Corning Inc., Corning, NY, USA) and proliferation was evaluated by XTT colorimetric assay kit (Roche: 11465015001) based on manufacturer’s instruction. Cell seeding concentration was 3000 cells/well; the experiment was performed in 6 technical replicates. The media were supplemented with factors tested or hormones and vehicle (see corresponding experiments) and were changed every second day.
Immunohistochemistry
For PgR and HER2 immunohistochemistry of tissue sections, we used 5 μm sections of paraffin blocks placed onto poly-L-lysine-coated slides. Samples were dewaxed by two 5-min washes in xylene and rehydrated with graded alcohol by 5-min washes and a final wash in water. A standard Tris-EDTA buffer and pressure-cooking was used for antigen retrieval and then sections were blocked in 0.3% H2O2 in TBS and 10% normal goat serum. Sections were incubated for 1 hour with primary antibodies and after washing secondary antibodies (Vector lab: PK4001 or PK5000) was added based on manufacturer’s recommended dilution (see AB Supplementary Table 9). After washing with PBS, sections were stained using the ABC detection system (Vector laboratory) according to the manufacturer’s instruction. Visualization was performed with chromogen reagent (Dako: 10046560) according to manufacturer’s instructions.
Immunofluorescence (IF) staining
For staining of cells from monolayer cell culture, cells were seeded onto 24 well culture plates in appropriate density. After 72 hours of incubation, cells were washed with PBS and fixed with 4% PFA for 10 minutes. Then, cells were permeabilized with 0.2% triton X100 followed by washing steps and blocking with 1% BSA/PBS at 37°C and incubated with primary antibody (please see Supplementary Table 9 for details) for 1 h at room temperature. Cells were then washed three times with PBS and incubated with labelled secondary antibody (Jackson ImmunoResearch Laboratory Inc) for 1 h at room temperature. For nuclear counterstaining, cells were incubated for 10 min with DAPI 0.5 μg/ml (Sigma). For the staining of spheres in differentiation experiments, mammospheres were picked and transferred to a 24-well cell culture plate and incubated for 8 h in sphere medium in order to fix them to the surface. The subsequent staining protocol was as for monolayer cell culture staining. For staining of cells attached to the inserts from migration experiments, inserts were used directly after migration (see section describing migration assay), for the blocking step and IF staining as monolayer cell culture staining procedure was applied. Images were captured on an AxioVert 200M microscopy (Carl Zeiss Microscopy).
Quantification of HER2 and PGR staining in tissue sections by TissueFAX cytometry
Tissue sections were stained with an automated staining machine (Ventana: BenchMark ULTRA). Tissue sections used for analysis were stained within the same run. Images of stained tissue sections were scanned with the TissueFAXSi-plus imaging system (TissueGnostics, Vienna, Austria; acquisition software: TissueFAXS version 3.5.129) equipped with a digital Pixelink colour camera (PCO AG, Kehlheim, Germany). Images for the analysis of HER2 and PgR staining were analysed with HistoQuest software version 3.5.3.0185 (TissueGnostics, Vienna, Austria). Using that software, two markers were created: hematoxylin as ‘master marker’ (nucleus) and HER2/PGR as ‘non-master marker’. To achieve optimal cell detection, the following parameters were adjusted: (i) nuclei size; (ii) discrimination by area; (iii) discrimination by gray and (iv) background threshold. For the evaluation of the HER2 staining intensity of cells or the percentage of progesterone-expressing cells, histograms were created, allowing the visualization of corresponding cells in the source region of interest using the real-time back gating feature. The cut-off discriminated between false events and specific signals according to cell size and intensity of staining. For HER2 staining, 38675 primary tumour cells (6 regions, 1.99 mm2), 28850 cells from hyperplastic regions (25 regions, 1.55 mm2) and 14938 cells from non-transformed ducts (30 regions, 0.93 mm2) were analysed. For PGR, 12269 cells of early lesions (hyperplasia, 7 weeks, 11 regions, 0.5 mm2), 12702 cells of non-transformed (normal duct 7 weeks, 56 regions, 0.7 mm2) and 25357 primary tumour cells (9 regions, 1.3 mm2) were analysed (Fig 1d).
Quantitative PCR
All mRNA extractions were performed using RNeasy kit (Qiagen: 74104) according to manufacturer’s instructions. For miRNA extraction miScript II RT Kit (Qiagen: 217004) was used. cDNA was generated using reverse transcriptase kit (Qiagen: 205311 for total RNA and 218161 for miRNA). Finally, 25 ng of cDNA was used for qPCR. Quantitative PCR was performed using a LightCycler instrument (Roche) and Fast Start Master SYBR Green Kits (Roche). Data analysis was done using the RelQuant software (Roche) with a reference gene and a calibrator (reference) sample in every run. Mouse reference cDNA served as a positive control. Measurements that showed unspecific products in the melting curve analysis were discarded from further analysis. Expression levels are given relative to Actb (β-actin) for gene expression analyses and Rnu6 for miRNA analyses (primer sequences are provided in Supplementary Table 10). All primers for mRNA analyses were synthesized by Eurofins MWG Operon, Germany, and for miRNA analyses ordered from Qiagen.
For comparison of miRNA levels in high-density and low-density regions (Extended Data Fig 10b) in FFPE samples, regions were punched out using a 1.5 mm puncher (PFM medical; 48115). Samples were incubated for 10 min at 70 °C followed by Xylene-Ethanol de-paraffinization and overnight PK (0.5 μg/μl, Roche 03115828001) digestion. Then miRNA extraction was performed using miRNeasy kit. For comparison of miR-30a-5p and miR-9-5p between HERhigh/PGRhigh human mammary carcinomas and HER2high/PGRneg carcinomas, miRNAs were extracted from fresh frozen samples using miRNeasy kit. Expression of miR-9-5p and miR-30a-5p was normalized to HER2−/PGRhigh breast cancers (see supplementary Table 6 for details on patients)
Lenti- and retroviral transduction
Pgr expression was achieved via a lentiviral construct encoding human Pgr-B (GeneCopeia: Z5911). Lentiviral packaging was conducted as previously described42. Helper vectors were pSPAX2 and pMD2.G (Addgene). Selection was performed using 10 μg/ml of puromycine (Sigma Aldrich : P8833). For Her2 expression pLXSN-NNeu (Rat wild type Neu/Her2) was used (obtained from Dr. Lisa Petti Albany Medical Center, Albany, NY)43. Retroviral delivery of transgenes was performed as described previously44. Helper vectors were pCMV-VSV-G and pUMVC3 obtained from Addgene. Selection was performed using 1000 μg/ml of G418 (Sigma Aldrich : G9516). MM3MG cells were transduced with lentiviruses and/or retroviral vectors and cell colonies were selected using antibiotics. Positively transduced clones were expanded and screened for PGR and/or HER2 levels by Western blot analysis and qPCR.
Western blot analysis
Cell lysates were prepared using RIPA buffer (Sigma; R0278) and were subjected to the BCA protein assay kit (Thermo scientific: 23227) to measure and equalize their protein concentration. Quantified protein lysates were resolved on 6.5 % SDS-PAGE gels, and transferred onto a polyvinylidene difluoride membrane (Millipore, Billerica, MA, USA), and immunoblotted with the primary antibodies overnight followed by incubation with the horseradish peroxidase-conjugated secondary antibodies. The blots were visualized using the substrate kit (GE Healthcare: RPN2109) and bands were visualized by Imagequant LAS 4000 (GE Healthcare). The full blot images are shown in Supplementary Fig. 1.
Exosome isolation, miRNA analyses and sequencing
To prepare conditioned medium, TUBO cells were seeded at a density of 3 × 10⁴ cells/cm2. After 4 days, media were collected, centrifuged and filtered and used as conditioned medium. For exosome isolation we used ultracentrifugation method as previously described45. Exosome pellets were resuspended in fresh medium and used for T47D cell line treatment. PGR expression was checked at different time points (4, 8, 24, and 48 hours). For miRNA sequencing we used 4 × 10⁶ cells and exosomes were isolated from confluent TUBO cell line medium. The miRNA cloning and sequencing was done as described previously46. All pooled samples were sequenced on a MiSeq system (Illumina) in a single end run with 80 cycles using MiSeq reagent kit Version 3. Data analysis was performed using in-house written scripts. Sequences were mapped - without any mismatches allowed - against murine miRNAs listed in miRBase version 20 (June 2013; www.mirbase.org). The minimum length of reads was set to 18 nt. Annotated miRNA-reads were normalized as RPM-Values regarding the total number of mapped reads in the respective library. Mimic miRNA were ordered from Eurofins MWG Operon Company and all sequences are listed in Supplementary Table 11. For miRNA transfection we used reverse transfection protocols recommended by RNAiMAX (Life Technology: 13778030) instruction and 50 nm/ml concentration of miRNA.
Mouse Genome CGH Microarrays
DNAs were extracted from fresh frozen samples using DNeasy Blood & Tissue Kit (Qiagen: 69504). Genomic DNA labelling was done using Agilent - SureTag DNA Labeling Kit (Agilent: 5190–3400). Array CGH was performed on oligonucleotide-based SurePrint G3 Mouse CGH Microarray Kit, 4×180K (design code: 027411) according to the protocol provided by the manufacturer (Agilent Oligonucleotide Array-Based CGH for Genomic DNA Analysis, version 7.2, July 2012).
Phylogeny of primary tumours and metastases
Ancestral relations among paired samples of primary tumour and metastases were inferred using array CGH profiles. The aCGH dataset consists of 28 primary tumour samples with 1 to 3 corresponding metastasis samples per primary tumour (18 primary tumours with 1 metastasis, 4 with 2 metastases and 6 with 3 metastases).
Positions of the probes on the array were mapped to the current mouse reference genome (mm10) using the liftOver tool47. No background correction was applied to the data48. The data were first normalized within arrays using Loess49. Then, log ratios were corrected for spatial artefacts using a median filter with an 11 × 11 block of probes50 and a between array scale normalization was applied51. Duplicate probes (having the same genomic position) were summarized by their median log ratio. The R package limma52 (version 3.28.1) was used for normalization within arrays and between arrays (with default parameters). In a final step, wavy patterns were removed from the data using an approach similar to Marioni et al.53 but with modifications to account for broad copy number alterations. For every sample and chromosome, correction proceeded as follows: since the maximum number of broad copy number alterations on any chromosome observed in the data was two, a piecewise constant function with two pieces was fitted to the log ratios to estimate these broad alterations. Each piece was required to be longer than 5% of the chromosome length to avoid spurious small pieces. The wavy pattern was estimated by fitting a Loess curve with a window size of 100 probes to the residuals of the piecewise constant function fit. To avoid smoothing true focal alterations, the weight of probes with an absolute log ratio deviation greater than 0.5 from the piecewise constant function were set to zero for the Loess fit. The estimated wavy pattern was then subtracted from the log ratios resulting in corrected values.
After normalization the log ratios were segmented using Circular Binary Segmentation as implemented in the R package DNAcopy54 (version 1.46.0). The default parameters were used except for alpha, which was set to 0.001. Segments with a length of 5 or less probes were merged with the closest adjacent segment. For every sample, states with means closer than 0.05 were merged iteratively beginning with the two states with closest means. When two states are merged the new mean is given by the mean of the two old state means weighted by the number of probes in every state. After state merging, the remaining segment means were adjusted to have a median of zero. These segmented copy number profiles were then deconstructed into underlying copy number events using Ziggurat Deconstruction55. All these steps where performed using R (version 3.3.0).
Aberration events as defined by left and right change points and aberration type were pooled across the matched samples of a single mouse to form a mouse-specific base set of aberration prototypes. For this, amplifications and deletions, respectively, that were similar by more than 80% as measured by their Jaccard-index regarding probe support were merged into single prototypes using Jaccard-distance-based complete linkage clustering and union of supports. Individual primary tumour and metastases samples were then encoded according to presence (absence) of the prototypic aberrations, whereby the present prototype was called by the minimum Jaccard-distance. The resulting feature vectors were then used for phylogenetic tree inference. Phylogenetic trees were generated by assuming ideal (i.e. error-free) data and inferring plausible common ancestors (intermediates) of aberration profiles by extracting shared features of an increasing number of samples, i.e. evaluating common aberration events in sample pairs, triplets, quads, etc., and organizing these ancestors according to hierarchical levels. Subsequently, admissible edges were constructed top-down between vertices allowing for at most two re-losses of acquired gains and no re-gains of any losses (this condition is also ensured globally for each path). Then all simple paths from the normal cell to the samples were generated using the igraph R-package (version 1.0.0), combined into a directed acyclic graph and filtered for fewest genomic changes along the graph and lowest number of intermediates (maximum parsimony). This resulted in one unique phylogenetic tree for each mouse.
Detection of human DCCs
For CGH analysis of single DCCs, bone marrow sampling of M1 stage patients was performed within the study protocol of the GEBDIS study at the Central Hospital in Augsburg after informed written consent of patients was obtained. The ethics committees of the University of Munich (ethics vote number 007/02) and Regensburg (ethics vote number 07-079) approved bone marrow sampling (including M0 stage patients) and genomic analysis of isolated cells. For all patients informed written consent was obtained. For bone marrow sampling and analysis for cytokeratin-positive cells of patients from Tübingen (approval by the ethics committee of Tuebingen University, reference number: 560/2012R) all specimens were obtained after written informed consent. Bone marrow sample preparation, slide preparation, cytokeratin staining and cell isolation was performed as previously described5.
Whole genome amplification and single cell comparative genomic hybridization
Whole genome amplification (WGA) was performed as previously described5,56. The method has become commercially available as kit (Ampli1, Silicon Biosystems). Histogram of copy number alterations (Figure 5e) was done for human primary breast cancers (n=1637) derived from the Progenetix data-base24 (http://www.progenetix.net and DCCs isolated from bone marrow of breast cancer patients without (M0; n=94; see Supplementary Table 7 for clinical details of patients) and with metastasis (M1; n=91).
Analysis of Breast Cancer Patients for association of DCC and primary tumour receptor expression
We analysed data of 2239 patients from the Department of Oncology and Obstetrics, University of Tubingen. DCC status was assessed according to the consensus protocol23, using the anti-cytokeratin antibody A45B/B3 and evaluating 2 × 10⁶ bone marrow cells. PgR expression of primary tumours was categorized into PGR staining scores 0–1 for absent expression; 2–8 for intermediate expression and 9–12 for high expression. HER2 status of primary tumours was categorized into the staining score 0 for absence of HER2 staining (IHC negative); score 1 and score 2 without Her2 amplification (IHC positive) and score 2 with HER2 amplification and 3 (which is known to be caused by HER2 amplification; FISH positive).
Bioinformatics and statistical analysis
Statistical analyses and estimation of variation within each group of data were performed using GraphPad Prism V6. For in vivo experiments, sample size was estimated using G*Power (version 3). For each experiment, mouse numbers are given in the figures or the text. All in vitro and primary culture experiments were performed at least in triplicate and student’s t-test was applied for comparisons. For all other experiments we applied the D’Agostino-Pearson omnibus normality test. When sample size was sufficiently large (n≥8) and were not distributed normally according to the D’Agostino-Pearson test (p≤0.05) we applied the Mann-Whitney test. A linear regression test (F-test for slopes) was used to compare proliferation curves and tumour growth. For comparing numbers between different groups we applied Fisher’s exact or if the sample numbers were at least 5 in each condition the chi-square test. In Figure 1d we applied the One way Anova-Test. All p values represent two tailed values. All p values (in range of 0.5≤p≤0.0001) and statistical tests are mentioned in the figures or legends. Genomatix (version 2.0) (https://www.genomatix.de) was used for signalling pathway analysis and oPOSSUM (version 1) (http://opossum.cisreg.ca/oPOSSUM3/) for transcription factor binding site (TFBS) enrichment. For miRNA binding enrichment we used DIANALAB (http://diana.cslab.ece.ntua.gr/) and for the identification of target miRNAs for single target genes the miRANDA software (http://www.microrna.org/microrna/home.do) was used.
Data Availability
The miRNA-seq data and microarray data are deposited at the GEO database under accession numbers GSE68683. Analysed data for microarray and miRNAs can be found in supplementary file 1 and 2 respectively. The mouse aCGH data are deposited at the GEO database under accession number GSE87469. All raw data for presented graphs and statistics deposited in source data files. Further material and data more than what is presented here can be obtained from the corresponding author (Christoph A Klein) upon request.
Extended Data
Extended Data Figure 1. EL signature induction and expression of Her2 and PgR.

(a) The proportion of cancer cells disseminating to bone marrow (BM) in Balb-NeuT mice decreases with increasing primary tumour volume. Disseminated cancer cells (DCCs) were identified using anti-CK antibodies in BM. The y-axis displays the number of detected DCCs per 106 BM cells divided by the total tumour area in mm2. The number of mice used per data point is written below the graph. (b) Laser microdissection of epithelial structures: two examples of 7–9 week old Balb-NeuT mammary glands showing microdissection of regions with incipient epithelial hyperplasia. For all samples similar amounts of tissue (up to 100,000 μm2) were isolated. (c) qPCR validation of microarray profiles. Quantitative PCR performed for 10 genes upregulated (Up: upregulated in EL) or downregulated (Down: downregulated in EL) in microarray samples and all except one (Zfp408) were confirmed. (d) Quantitative PCR for the mRNA level of all steroid hormone receptors (EL, early lesions; PT, advanced primary tumour; Met, lung metastasis). (e) Primary cultures from mammary tissue of 7–9 week old Balb-NeuT mice, were treated with progesterone (P), estrogen (E), aldosterone (A), cortisol (C), and testosterone (T) in different concentrations (1, 10, and 100 nM) or vehicle (ethanol; untreated) for 75 hours. Only progesterone induces upregulation of the complete EL signature. (f) Elevated expression of PgR-B in young mammary glands (BALB/c week 9 and Balb-NeuT EL compared to BALB/c week 25) but not primary tumours correlates with elevated HER2 expression. (g) Progesterone induces the EL signature in 4T1 cells (highly aggressive and metastatic cell line derived from a spontaneous BALB/c mammary tumour), but not in 67NR (tumorigenic and non-metastatic cell line derived from spontaneous BALB/c mammary tumour) and MM3MG cells (normal mammary epithelial cell line derived from BALB/c mouse). (h) Progesterone treatment up-regulates HER2 in 4T1 cells. (i) Overexpression of PGR-B in MM3MG cells up-regulates HER2 expression. All p-values, Student’s t-test; *, p≤0.05; **, p≤0.01; all error bars correspond to standard deviation (Mean ±SD). For gel source data, see Supplementary Figure 1.
Extended Data Figure 2. Progesterone regulates migration and is linked to branching morphogenesis.

(a) qPCR analysis of Pgr, Rank, Rankl and Wnt4 in normal and transgenic mammary tissue or tumours. Note the elevated expression of Pgr, Wnt4, and Rankl in EL compared to PT. Only Rank (receptor of Rankl) is strongly expressed in primary tumours. (b) Primary cultures of EL treated with progesterone (P), WNT4, and RANKL. WNT4 and RANKL treatment induce the EL signature and act synergistically. (c–d) PGR (green) staining at 5 weeks and 12 weeks of age (FVB wild type mice; scale bar = 100 μm). The percentage of PGR+ cells per duct was quantified (two mice/age group) in the anterior and posterior portions of the gland (relative to lymph node, LN). PGR expressing cells were more abundant in anterior ducts (number of analysed ducts per group is displayed on top of each column). (e–f) Photomicrograph of migration assay (E) and quantification (F) of migrating cells derived from fresh tissue (e, left panel) or dissociated PT- and EL-spheres (e, right panel; f, quantification). Progesterone (P), WNT4, and RANKL induce migration of EL-derived but not PT-derived cells (see also Figure 2a). (g) Scheme of combined migration and sphere assay. The lower chamber is filled with serum-free sphere medium and its bottom is covered with poly-HEMA to prevent adhesion and enable sphere formation. After 72 h migration, the insert is removed and the lower chamber is monitored (after 11 days) for mammosphere formation. (h) Effect of estrogen and progesterone on migration and sphere formation of EL-derived mammary cells. Cells were exposed to either 10 nM estrogen (E) or progesterone (P) or 10 nM estrogen in the presence of 10 nM progesterone inhibitor RU486. All p-values, student’s t-test; *, p≤0.05; **, p≤0.01; ***, p≤0.001; ****, p≤0.0001; error bars in panel d correspond to standard error of the mean (Mean ±SEM); all other error bars correspond to standard deviation (Mean ±SD).
Extended data Fig 3. HER2 expression levels regulate migration and proliferation.
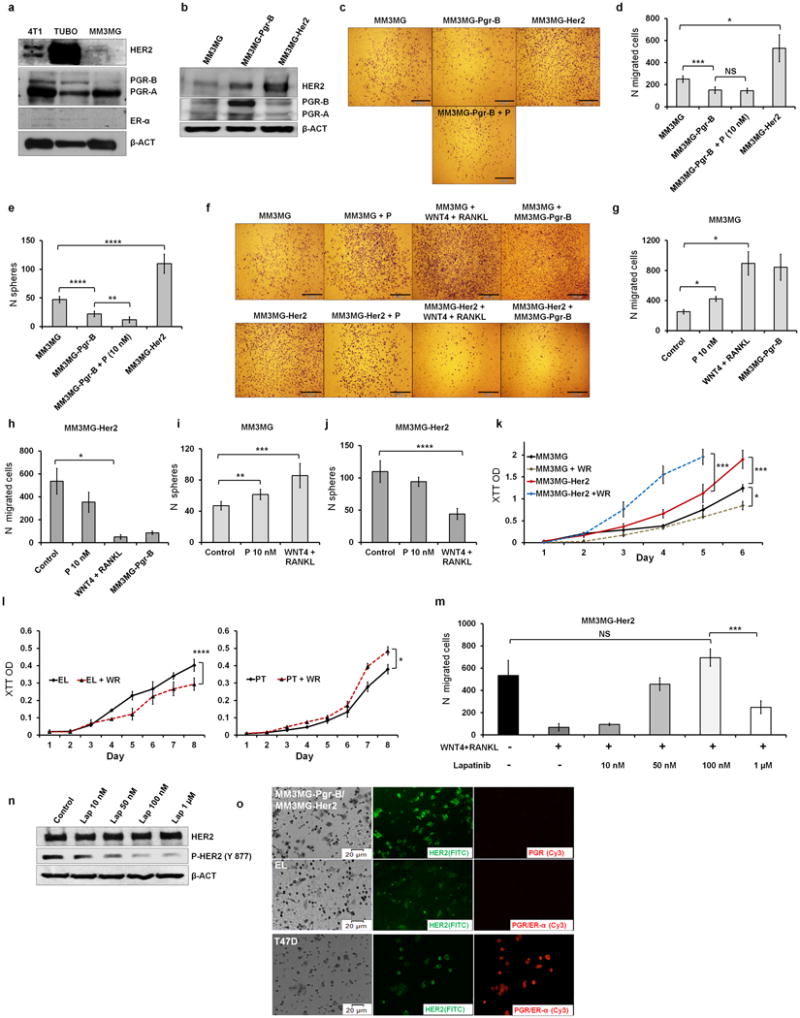
(a) Parental MM3MG cells, a cell line derived from mammary epithelial cells of wild-type BALB/c mice, do not express ERα but low levels of HER2 and PGR-B when compared to 4T1 and TUBO cells (TUBO cells were grown at low density; see Figure 3 and Extended Data Fig 4–5 for reasoning). (b) Immunoblot confirming successful transduction of the MM3MG cell line with Her2 and Pgr-B. Note that transduction of Pgr B increases HER2 levels. (c–d) Overexpression of Pgr-B in MM3MG cells reduces migration, while Her2 overexpression (MM3MG-Her2) increases migration of cells. Addition of progesterone does not alter migration of PGR-B-overexpressing cells (MM3MG-Pgr-B). (e) Overexpression of Pgr-B in MM3MG cells reduces sphere-forming ability whereas Her2 overexpression increases it. These results (c–e) suggest that migrating/sphere forming cells are not among the PGR+ but among the PGR− population responsive to PIPS. (f–j) To explore which PGR negative cells are the target population of progesterone signalling, we exposed parental MM3MG cells and Her2-transduced cells to progesterone, PIPS or mixed them with PGR+ cells (only for migration experiments). Progesterone, WNT4/RANKL, and co-culture with MM3MG-Pgr-B (only migration) induce sphere formation and migration of MM3MG cells but decrease these responses in MM3MG-Her2 cells. (k) Overexpression of Her2 increases proliferation of MM3MG cells (MM3MG-Her2). WNT4 plus RANKL (WR) further increase proliferation of MM3MG-Her2 cells, but decrease proliferation of parental (MM3MG) cells. Therefore based on expression of HER2, cells either migrate (HER2low/negative) or proliferate (HER2high). (l) WNT4 plus RANKL (WR) treatment induces proliferation of primary cultured PT cells, but reduces it in EL-derived cells. (m) Reduction of HER2 signalling by lapatinib overrides the inhibitory effect of WNT4 plus RANKL and increases migration in MM3MG-Her2 cells. However, strong inhibition of HER2 signalling reduces migration. (n) Lapatinib inhibits HER2 signalling by preventing phosphorylation. (o) Cells that migrated through the pores of the migration chamber insert were stained for HER2 (FITC, green) and PGR/ER-α (Cy3, red). In 1:1 co-culture of MM3MG-Pgr-B and MM3MG-Her2 (upper panel) only Her2-expressing cells migrate. Migrated EL-derived primary cells (lower panel) do not express PGR and display faint HER2 staining (brightness of HER2 and PGR staining in lower panel micrographs were increased by 50% for better visibility). HER2 and PGR double-positive T47D cells fixed onto the filters of migration chambers serve as positive control of staining. These results (m-o) indicate that cells with low/intermediate signalling of HER2 respond best to migration and sphere formation inducing PIPS. P-values for the migration and sphere assays represent Student’s t-test; p-values for the proliferation curves (k,l) were derived from F-tests for the slopes; *, p≤0.05; **, p≤0.01; ***, p≤0.001; ****, p≤0.0001; NS, Not Significant; all error bars correspond to standard deviation (Mean ±SD). For gel source data, see Supplementary Figure 1.
Extended Data Figure 4. Cell density and regulation of progesterone and HER2 signalling.

(a) PGR expression silenced in tumours can be re-activated in culture and re-silenced in vivo. (b) PGR re-expression in TUBO cells grown at low density and high density only after frequent medium change. (c) Down-regulation of PGR in EL cells cultured in a transwell assay next to primary tumour cells suggests the existence of a secreted factor passing through the membrane of the transwell insert and down-regulating Pgr mRNA (left) and protein (right). (d) T47D cells exposed to conditioned medium from TUBO cells display reduced Pgr mRNA (left) and protein (right). (e) Exosomes derived from the cell culture medium of TUBO cells grown at high density (exosome fraction) induce down-regulation of Pgr in T47D cells. (f) Results of miRNA sequencing to identify Pgr regulating miRNAs. The left table lists the top 10 up-regulated miRNAs in HER2-overexpressing cells (MM3MG-Her2) compared to control (MM3MG). The middle table presents the top 10 expressed miRNAs in TUBO cells and TUBO cell-derived exosomes. The right table displays miRNAs predicted by the miRanda web-software to regulate Pgr. (g) Among all candidate miRNAs only miR-30a-5p and 9-5p induce down-regulation of Pgr mRNA in T47D cells. (h) Down-regulation of PGR in T47D cells treated with miR-30a-5p and 9-5p. (i) Expression of miR-30-5p in EL and PT samples compared to 8 week BALB/c mammary glands. (j) Density induced up-regulation of HER2 in TUBO cells grown at low or high density and EL vs. PT samples (left panel) and progesterone-responsiveness of low-density TUBO cells. Note that levels of HER2, PGR, NR3C11, NR3C2, and AR are regulated by progesterone in a dose dependent manner. (k-m) TUBO cells grown at low density and exposed to progesterone (P) or PIPS migrated more (k–l) and produced more spheres (m), similar to EL-derived cells (See Figure 2). **, p≤0.01; ***, p≤0.001; ****, p≤0.0001; All error bars correspond to standard deviation (Mean ±SD). For gel source data, see Supplementary Figure 1.
Extended Data Figure 5. Cell density and regulation of progesterone and HER2 signalling in human cell lines.
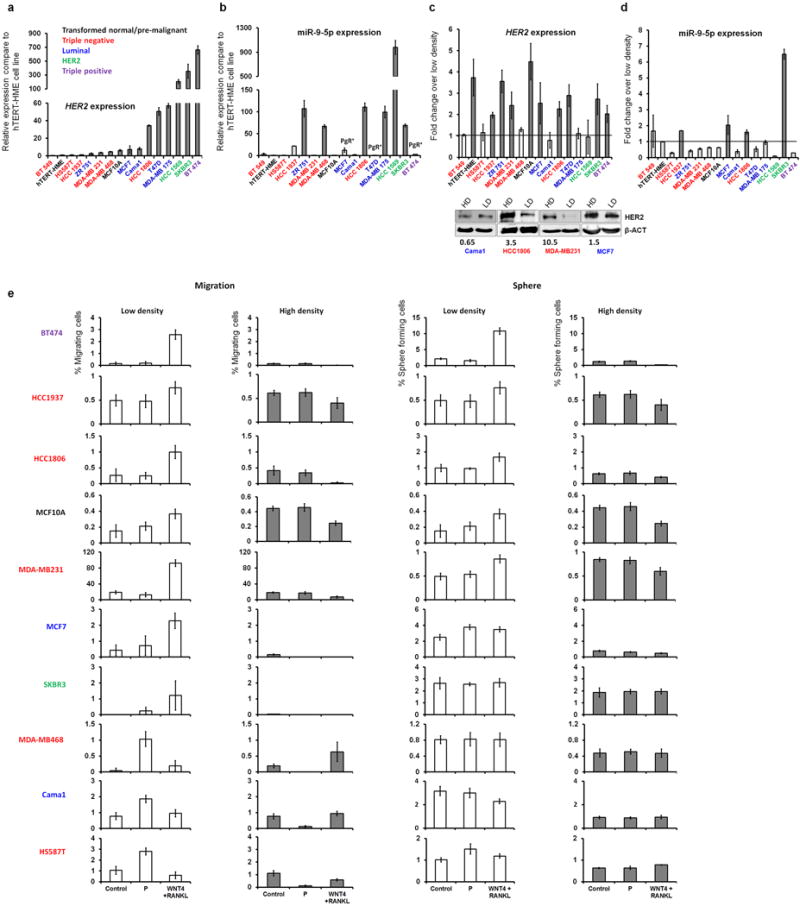
To explore whether human breast cancer cells display similar regulatory circuits as found in murine cells, we selected 16 cell lines of different breast cancer subtypes. (a) Her2 mRNA expression levels in 15 human cell lines compared to the h-TERT-HME cells. Different colours of cell line names indicate subtype of breast cancer with the colour key for the breast cancer subtype of cell lines being shown in the figure. (b) The expression of miR-9-5p in human breast cancer cell lines compared to h-TERT-HME cells. Note that Her2 strong-expressing cell lines (see panel a) express more miR-9-5p similar to PTs of Balb-NeuT and TUBO cells (See Fig 3b–c), but two HER2high/PGRhigh cell lines, BT474 and T47D do not express miR-9-5p similar to human HER2high/PGRhigh samples (See Figure 5d). (c) High cell density up-regulates Her2 at mRNA (upper panel) or protein levels (lower panel) in several cell lines. Only four cell lines were checked for protein level (HER2 level not influenced by cell density – Cama1; HER2 level regulated by cell density – HCC1806, MDA-MB-231, and MCF7). Numbers below the blots indicate fold-change of HER2 in high density compared to low density normalized over beta actin. (d) Expression of miR-9-5p is up-regulated by cell density in SKBR3, HCC1937, HCC1806, and MCF7 cell lines. (e) Migration and sphere-forming potential of 10/16 cell lines grown at low and high densities, and treated with PIPS or progesterone. The first 7 cell lines regulate Her2 transcripts by density (See panel c) and their response to PIPS is similar to TUBO cells and primary mammary cell cultures of Balb-NeuT mice (See Figures 2, and Extended Data Fig 4l–m). The remaining three cell lines do not regulate Her2 transcripts by cell density but respond to progesterone similarly to TUBO cell line and primary mammary cell cultures of Balb-NeuT mice (See Figures 2, and Extended Data Fig 4l–m). We did not perform functional assays with BT549 (TN), T47D (luminal, MCF7-like), MDA-MB-175, ZR75-1 (luminal, CAMA1-like), hTERT-HME (transformed normal, similar to MCF-10A) because of breast cancer subtype redundancy or poor growth (HCC1569). Y-axes show the percentage of migrating cells (left) and observed spheres (right) relative to seeded cells. All error bars correspond to standard deviation (Mean ±SD). For gel source data, see Supplementary Figure 1.
Extended Data Figure 6. Differentiation ability and metastasis formation.
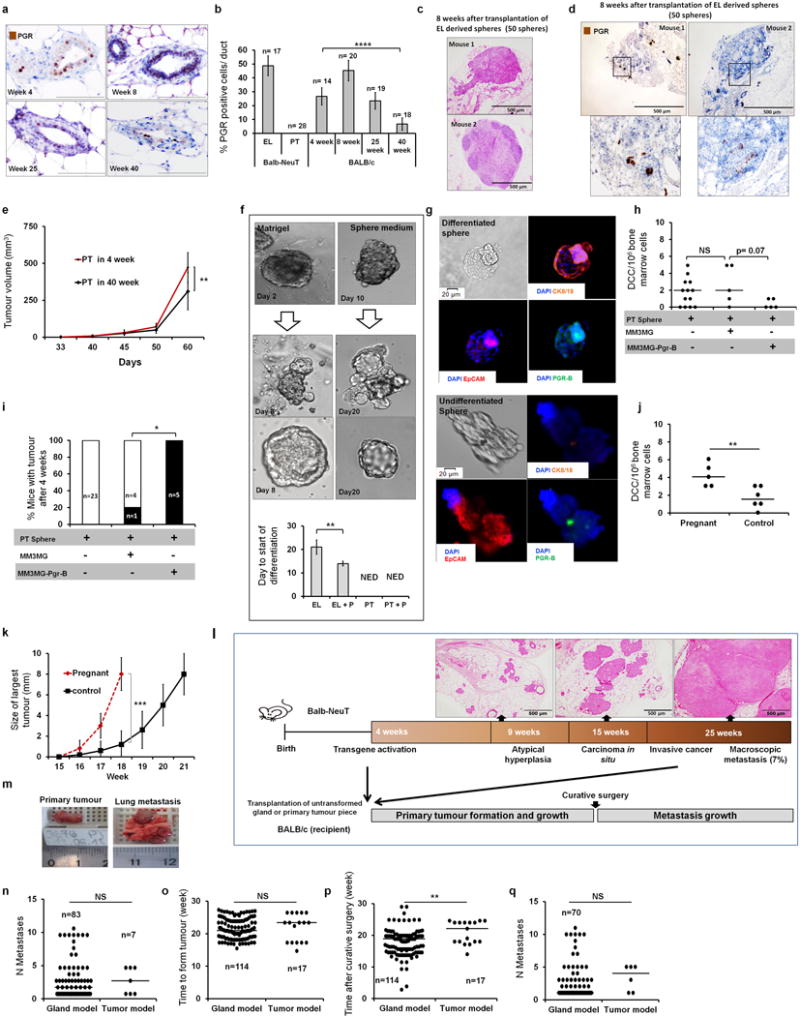
(a–b) PGR expression of mammary epithelial cells from wt-BALB/c mice at 4, 8, 25 and 40 weeks of age (scale bar = 100 μm). PGR expression was reduced by 75% in 40-week-old wild-type mammary gland compared to week-4 mice and disappeared in PT (See also Extended Data Fig 1f and Extended Data Fig 2a). N indicates number of ducts/glands (in EL and normal tissue) or visual fields in primary tumours. (c–d) Representative micrographs of lesions 8 weeks after transplantation of EL-spheres resembling DCIS (c) or less advanced EL (d) displaying PGR expression (PGR, brown nuclear staining). (e) Tumour growth from PT spheres in young and old recipients. (f) Differentiation of mammary epithelial cells from EL in matrigel (right panel) or in sphere culture (left panel) into acinus-like structures. PT cells did not generate acinus-like structures. Progesterone (P) stimulation accelerated formation of acinus-like structures by EL cells, under mammosphere conditions (NED, no evidence of differentiation). (g) Staining for CK8/18, PGR, and EpCAM reveals exclusive expression of PGR and CK8/18 in differentiated structures (upper panel) as compared to undifferentiated spheres (lower panel). (h–i) PT spheres were transplanted alone (n=23) or co-transplanted with MM3MG-Pgr-B (n=5) or MM3MG spheres (n=5). The number of DCCs in bone marrow (panel h) and the number of mice with tumour (panel i) were checked 4 weeks later. Pgr-B-transduced mammary epithelia (MM3MG) suppress metastatic dissemination (evaluated as BM-DCC counts) from PT spheres (h). PGR enriched environment induces tumour growth. One out of 5 in the PT+MM3MG transplanted group and 5 out of 5 in the PT+MM3MG-Pgr-B transplanted group formed tumours, while no mouse transplanted only with PT-spheres formed tumours within 4 weeks after transplantation (i). (j) Pregnancy at EL-stage induces dissemination. A group of young Balb-NeuT mice mated (n=5) at EL stage (week 7) and were sacrificed at the end of pregnancy. These mice did not formed palpable tumours, but had higher number of DCCs compared to unmated mice (n=6) as control. (k) Pregnancy at advanced tumour stage. A group of Balb-NeuT mice (n=5) were mated at the time of in situ carcinoma (week 15) and sacrificed at the end of pregnancy. All pregnant mice had faster growing tumours compared to unmated control mice. (l) Schematic of transplantation protocol for mammary gland or PT tissue pieces into wild type recipients. (m) Example of PT and macro-metastasis assessment. (n) Number of metastatic foci in transplanted mice. 18 mice from gland model, and 3 mice from tumour model were excluded from analyses due to the fusion of metastatic lesions making it difficult to count individual lesions. (o) Similar growth kinetics of primary tumours from gland and tumour piece model for samples from red box in Figure 4e. (p–q) Mice from (o) were compared for duration follow-up period after surgery. Mice from both groups were sacrificed at first signs of general health deterioration, which occurred earlier in gland-model mice (p). Longer follow-up time after curative surgery did not result in more metastases in recipients transplanted with PT pieces (q). p-value in panels b, f, h and j Student’s t-test; in panel i, Fisher’s exact test; in panel c, and k were derived from F-test for the slopes; in panels n, o, p, and q, Mann-Whitney test; *, p≤0.05; **, p≤0.01; ***, p≤0.001; ****, p≤0.0001; NS, Not Significant; error bars in panels b, e, f, and k correspond to standard deviation (Mean ±SD) and panels h, j, n, o, p, and q represent median.
Extended Data Figure 7. Array CGH analysis of primary tumour – metastasis pairs.
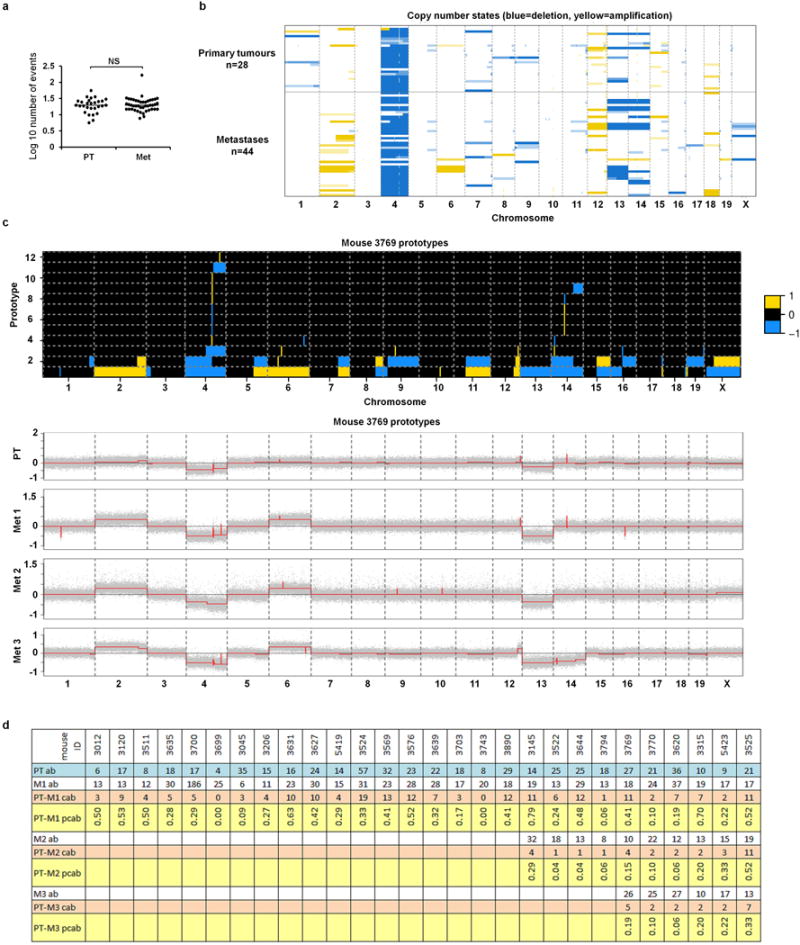
(a) Number of aberrations detected by aCGH in primary tumours and matched lung metastases (dot plot displays median; p-value, Mann-Whitney test). (b) Heatmap of copy number states for the 28 primary tumours and 44 matched metastases across chromosomes 1–19 and X. Light, medium and dark yellow/blue colours indicate weak, intermediate and strong amplification/deletion amplitudes, respectively (thresholds at ±0.1, ±0.2, ±0.3). (c) Prototype aberrations (top) constructed from segmented array CGH profiles (bottom) of the primary tumour (PT) and the matched metastases (Met 1–3) of mouse 3769 (phylogenetic tree and phylogenetic paths displayed in Figure 4h–i). Prototypes (top) are organized in stacked rows per chromosome and numbered according to chromosome and positional order of their first change point, e.g. 1.2 denotes the 2nd prototype of chromosome 1. These prototype aberrations are then used to construct the phylogenetic paths (e.g. Figure 4i) and trees. For better visibility, small focal aberrations were enlarged to have a minimal extension of 300 probes. Yellow colour indicates amplification (+1) while blue colour encodes deletion (−1). Corresponding segmentation profiles of the normalized and wavy-pattern-corrected array CGH data (grey dots) are indicated by red lines (bottom). For segmentation and prototype construction see Methods. (d) Table for calculating the relative time points of dissemination (Figure 4j). PT ab: number of aberrations in the primary tumour; Mk ab: number of aberrations in the matched metastases (k=1,2,3); PT-Mk cab: number of common aberrations between PT and Mk; PT-Mk pcab: proportion of common aberrations relative to the primary tumour, i.e. pcab = cab/PT ab.
Extended Data Figure 8. Phylogenetic analysis of metastasis (part 1: early divergence).

Phylogenetic trees of the top 13 of the 28 primary tumours and matched metastases samples listed according to earliest time point of dissemination (for details see tables in Extended Data Figures 7 and 9). Normal cells are indicated by N, primary tumours by P and metastases by M1-3. Profiles A1-7 denote inferred common ancestors (intermediates) (see Methods). The ordinate indicates the number of aberrations per profile (on a square root scale). For the first three matched samples, also the tree paths (mid), prototype aberrations (top right) and segmented array CGH profiles (bottom right) are displayed in addition to the phylogenetic tree (left). Aberration profiles along phylogenetic paths run from N via A1-7 to P or M1-3. Aberration prototypes are named according to chromosome and positional order of their first change point, e.g. 2.2 denotes the 2nd aberration prototype of chromosome 2 (see Methods and Extended Data Figure 7c).
Extended Data Figure 9. Phylogenetic analysis of metastasis (part 2: late divergence).

(a) Phylogenetic trees of the top 14 of the 28 primary tumour (PT) and matched metastasis (M) samples listed according to latest time point of dissemination. For the first three mice also the phylogenetic paths (mid), prototype aberrations (top right) and segmented array CGH profiles (bottom right) are shown next to the phylogenetic tree (left). See Methods and Extended Data Figures 7 and 8. (b) Summary table of all phylogenetic analyses indicates the position of the corresponding mouse phylogenetic tree in Extended Data Figure 8 (EDF8) and 9 (EDF9) for each primary tumour–metastasis-pair. The two bottom rows indicate the rank and the corresponding relative time point of dissemination as measured by the proportion of aberrations shared between PT and M (PT-M pcab; see Extended Data Figure 7 and Fig 4j). Note that only metastases ranked on position 36–44 diverged late as per our definition. The phylogenetic tree and phylogenetic paths for mouse 3769 are displayed in main Figure 4h–i. In the “pos-EDF8” and “pos-EDF9” rows the darker colours are those samples that all pieces of data including phylogenetic paths, prototype aberrations, segmented array CGH profiles, and phylogenetic trees are shown. Faint colours cells in “pos-EDF8” and “pos-EDF9” are samples those only phylogenetic trees are shown for them.
Extended Data Figure 10. PGR, HER2 signalling, and dissemination in breast cancer patients.

(a) Double staining of HER2high/PGRhigh human breast cancer sample (PGR: brown, nucleus; HER2: red/pink, membrane). Cells with varying expression levels of HER2 and PGR, as well as negative, single- or double-positive cells can be seen (scale bar = 100 μm). Arrows indicate DP, double-positive; DN, double-negative; SP, single-positive. (b) Lack of PGR expression in high-density areas of HER2high/PGRhigh classified tumour samples is directly linked to high miR-9-5p and miR-30a-5p expression. Panel b represents standard deviation (Mean ±SD).
Supplementary Material
Acknowledgments
We are indebted to T. Perry for his critical reading of the manuscript. This work was supported by grants from the DFG (Kl 1233/2-1, KL 1233/3-1, KL 1233/10-1 (CAK); Me2064/4-1, (GM); SP 938/2-1 (RS)); the Dr. Josef Steiner Foundation andf ERC (322602) to CAK; the SWCRF, CA109182, CA196521, CA163131, BC132674 (J.A.A-G) CA183185 (K.H.) BC112380 (M.S.S.) and by a donation from Anna Jungmayer.
Footnotes
AUTHOR CONTRIBUTIONS
C.A.K. and H.H. designed and evaluated core experiments. H.H. performed core experiments. M.M.S.O., C.W., L.K.N., C.E., C.R. and Miodrag G. helped in vivo, in vitro and primary culture experiments. M.H., M.M., Michael G., R.S. and H.H. performed bioinformatic and statistical analyses. M.W-K., M.S.S. and F.W. performed staining and pathological analysis. N.E. and G.M. performed miRNA sequencing and analysis. G.H, N.P. A.H., F-A.T., S.Y.B., B.R., S.B. and T.F. performed DCC analysis or collected patient data. C.A.K and H.H. wrote the manuscript with input from J.A-G.
The authors declare no competing financial interests.
Readers are welcome to comment on the online version of the paper.
References
- 1.Aguirre-Ghiso JA, Bragado P, Sosa MS. Metastasis awakening: targeting dormant cancer. Nature medicine. 2013;19:276–277. doi: 10.1038/nm.3120. [DOI] [PMC free article] [PubMed] [Google Scholar]
- 2.Polzer B, Klein CA. Metastasis awakening: the challenges of targeting minimal residual cancer. Nature medicine. 2013;19:274–275. doi: 10.1038/nm.3121. [DOI] [PubMed] [Google Scholar]
- 3.Cole BF, Gelber RD, Gelber S, Coates AS, Goldhirsch A. Polychemotherapy for early breast cancer: an overview of the randomised clinical trials with quality-adjusted survival analysis. Lancet. 2001;358:277–286. doi: 10.1016/S0140-6736(01)05483-6. [DOI] [PubMed] [Google Scholar]
- 4.Gianni L, et al. Treatment with trastuzumab for 1 year after adjuvant chemotherapy in patients with HER2-positive early breast cancer: a 4-year follow-up of a randomised controlled trial. Lancet Oncol. 2011;12:236–244. doi: 10.1016/S1470-2045(11)70033-X. doi: 10.1016/S1470-2045(11)70033-XS1470-2045(11)70033-X [pii] [DOI] [PubMed] [Google Scholar]
- 5.Klein CA, et al. Genetic heterogeneity of single disseminated tumour cells in minimal residual cancer. Lancet. 2002;360:683–689. doi: 10.1016/S0140-6736(02)09838-0. [DOI] [PubMed] [Google Scholar]
- 6.Schmidt-Kittler O, et al. From latent disseminated cells to overt metastasis: genetic analysis of systemic breast cancer progression. Proc Natl Acad Sci USA. 2003;100:7737–7742. doi: 10.1073/pnas.1331931100. [DOI] [PMC free article] [PubMed] [Google Scholar]
- 7.Klein CA. Parallel progression of primary tumours and metastases. Nature reviews Cancer. 2009;9:302–312. doi: 10.1038/nrc2627. [DOI] [PubMed] [Google Scholar]
- 8.Hüsemann Y, et al. Systemic spread is an early step in breast cancer. Cancer Cell. 2008;13:58–68. doi: 10.1016/j.ccr.2007.12.003. [DOI] [PubMed] [Google Scholar]
- 9.Rhim AD, et al. EMT and dissemination precede pancreatic tumor formation. Cell. 2012;148:349–361. doi: 10.1016/j.cell.2011.11.025. [DOI] [PMC free article] [PubMed] [Google Scholar]
- 10.Eyles J, et al. Tumor cells disseminate early, but immunosurveillance limits metastatic outgrowth, in a mouse model of melanoma. J Clin Invest. 2010;120:2030–2039. doi: 10.1172/JCI42002. [DOI] [PMC free article] [PubMed] [Google Scholar]
- 11.Banys M, et al. Hematogenous and lymphatic tumor cell dissemination may be detected in patients diagnosed with ductal carcinoma in situ of the breast. Breast Cancer Res Treat. 2012;131:801–808. doi: 10.1007/s10549-011-1478-2. [DOI] [PubMed] [Google Scholar]
- 12.Sanger N, et al. Disseminated tumor cells in the bone marrow of patients with ductal carcinoma in situ. Int J Cancer. 2011;129:2522–2526. doi: 10.1002/ijc.25895. [DOI] [PubMed] [Google Scholar]
- 13.Valastyan S, Weinberg RA. Tumor metastasis: molecular insights and evolving paradigms. Cell. 2011;147:275–292. doi: 10.1016/j.cell.2011.09.024. [DOI] [PMC free article] [PubMed] [Google Scholar]
- 14.Fernandez-Valdivia R, et al. Revealing progesterone’s role in uterine and mammary gland biology: insights from the mouse. Semin Reprod Med. 2005;23:22–37. doi: 10.1055/s-2005-864031. [DOI] [PubMed] [Google Scholar]
- 15.Mulac-Jericevic B, Lydon JP, DeMayo FJ, Conneely OM. Defective mammary gland morphogenesis in mice lacking the progesterone receptor B isoform. Proceedings of the National Academy of Sciences of the United States of America. 2003;100:9744–9749. doi: 10.1073/pnas.1732707100. [DOI] [PMC free article] [PubMed] [Google Scholar]
- 16.Aupperlee MD, Smith KT, Kariagina A, Haslam SZ. Progesterone receptor isoforms A and B: temporal and spatial differences in expression during murine mammary gland development. Endocrinology. 2005;146:3577–3588. doi: 10.1210/en.2005-0346. [DOI] [PubMed] [Google Scholar]
- 17.Brisken C. Progesterone signalling in breast cancer: a neglected hormone coming into the limelight. Nature reviews Cancer. 2013;13:385–396. doi: 10.1038/nrc3518. [DOI] [PubMed] [Google Scholar]
- 18.Liao MJ, et al. Enrichment of a population of mammary gland cells that form mammospheres and have in vivo repopulating activity. Cancer research. 2007;67:8131–8138. doi: 10.1158/0008-5472.can-06-4493. [DOI] [PubMed] [Google Scholar]
- 19.Korkaya H, Paulson A, Iovino F, Wicha MS. HER2 regulates the mammary stem/progenitor cell population driving tumorigenesis and invasion. Oncogene. 2008;27:6120–6130. doi: 10.1038/onc.2008.207. [DOI] [PMC free article] [PubMed] [Google Scholar]
- 20.Ginestier C, et al. ALDH1 is a marker of normal and malignant human mammary stem cells and a predictor of poor clinical outcome. Cell stem cell. 2007;1:555–567. doi: 10.1016/j.stem.2007.08.014. [DOI] [PMC free article] [PubMed] [Google Scholar]
- 21.Lee YJ, Gorski J. Estrogen-induced transcription of the progesterone receptor gene does not parallel estrogen receptor occupancy. Proceedings of the National Academy of Sciences of the United States of America. 1996;93:15180–15184. doi: 10.1073/pnas.93.26.15180. [DOI] [PMC free article] [PubMed] [Google Scholar]
- 22.Stephens PJ, et al. The landscape of cancer genes and mutational processes in breast cancer. Nature. 2012;486:400–404. doi: 10.1038/nature11017. [DOI] [PMC free article] [PubMed] [Google Scholar]
- 23.Fehm T, et al. A concept for the standardized detection of disseminated tumor cells in bone marrow from patients with primary breast cancer and its clinical implementation. Cancer. 2006;107:885–892. doi: 10.1002/cncr.22076. [DOI] [PubMed] [Google Scholar]
- 24.Baudis M. Progenetix - cytogenetic abnormalities in human cancer. 2000 http://www.progenetix.net, < http://www.progenetix.net>.
- 25.Guzvic M, et al. Combined genome and transcriptome analysis of single disseminated cancer cells from bone marrow of prostate cancer patients reveals unexpected transcriptomes. Cancer research. 2014;74:7383–7394. doi: 10.1158/0008-5472.can-14-0934. [DOI] [PubMed] [Google Scholar]
- 26.Klein CA. Framework models of tumor dormancy from patient-derived observations. Current opinion in genetics & development. 2011;21:42–49. doi: 10.1016/j.gde.2010.10.011. [DOI] [PubMed] [Google Scholar]
- 27.Brastianos PK, et al. Genomic Characterization of Brain Metastases Reveals Branched Evolution and Potential Therapeutic Targets. Cancer discovery. 2015 doi: 10.1158/2159-8290.CD-15-0369. [DOI] [PMC free article] [PubMed] [Google Scholar]
- 28.Brisken C, et al. Essential function of Wnt-4 in mammary gland development downstream of progesterone signaling. Genes Dev. 2000;14:650–654. [PMC free article] [PubMed] [Google Scholar]
- 29.Fernandez-Valdivia R, et al. The RANKL signaling axis is sufficient to elicit ductal side-branching and alveologenesis in the mammary gland of the virgin mouse. Dev Biol. 2009;328:127–139. doi: 10.1016/j.ydbio.2009.01.019. [DOI] [PubMed] [Google Scholar]
- 30.Asselin-Labat ML, et al. Steroid hormone receptor status of mouse mammary stem cells. J Natl Cancer Inst. 2006;98:1011–1014. doi: 10.1093/jnci/djj267. [DOI] [PubMed] [Google Scholar]
- 31.Joshi PA, et al. Progesterone induces adult mammary stem cell expansion. Nature. 2010;465:803–807. doi: 10.1038/nature09091. [DOI] [PubMed] [Google Scholar]
- 32.Mukherjee A, et al. Targeting RANKL to a specific subset of murine mammary epithelial cells induces ordered branching morphogenesis and alveologenesis in the absence of progesterone receptor expression. Faseb j. 2010;24:4408–4419. doi: 10.1096/fj.10-157982. [DOI] [PMC free article] [PubMed] [Google Scholar]
- 33.Narod SA, Iqbal J, Giannakeas V, Sopik V, Sun P. Breast Cancer Mortality After a Diagnosis of Ductal Carcinoma In Situ. JAMA oncology. 2015;1:888–896. doi: 10.1001/jamaoncol.2015.2510. [DOI] [PubMed] [Google Scholar]
- 34.Astolfi A, et al. Gene expression analysis of immune-mediated arrest of tumorigenesis in a transgenic mouse model of HER-2/neu-positive basal-like mammary carcinoma. The American journal of pathology. 2005;166:1205–1216. doi: 10.1016/S0002-9440(10)62339-5. [DOI] [PMC free article] [PubMed] [Google Scholar]
- 35.Ignatiadis M, et al. HER2-positive circulating tumor cells in breast cancer. PLoS One. 2011;6:e15624. doi: 10.1371/journal.pone.0015624. [DOI] [PMC free article] [PubMed] [Google Scholar]
- 36.Hafner C, et al. Oncogenic PIK3CA mutations occur in epidermal nevi and seborrheic keratoses with a characteristic mutation pattern. Proceedings of the National Academy of Sciences of the United States of America. 2007;104:13450–13454. doi: 10.1073/pnas.0705218104. [DOI] [PMC free article] [PubMed] [Google Scholar]
- 37.Hafner C, et al. Multiple oncogenic mutations and clonal relationship in spatially distinct benign human epidermal tumors. Proceedings of the National Academy of Sciences of the United States of America. 2010;107:20780–20785. doi: 10.1073/pnas.1008365107. [DOI] [PMC free article] [PubMed] [Google Scholar]
- 38.Pollock PM, et al. High frequency of BRAF mutations in nevi. Nature genetics. 2003;33:19–20. doi: 10.1038/ng1054. [DOI] [PubMed] [Google Scholar]
- 39.Hutchinson JN, Jin J, Cardiff RD, Woodgett JR, Muller WJ. Activation of Akt-1 (PKB-alpha) can accelerate ErbB-2-mediated mammary tumorigenesis but suppresses tumor invasion. Cancer research. 2004;64:3171–3178. doi: 10.1158/0008-5472.can-03-3465. [DOI] [PubMed] [Google Scholar]
- 40.Liu H, et al. MYC suppresses cancer metastasis by direct transcriptional silencing of alphav and beta3 integrin subunits. Nature cell biology. 2012;14:567–574. doi: 10.1038/ncb2491. [DOI] [PMC free article] [PubMed] [Google Scholar]
- 41.VerMilyea MD, et al. Transcriptome asymmetry within mouse zygotes but not between early embryonic sister blastomeres. The EMBO journal. 2011;30:1841–1851. doi: 10.1038/emboj.2011.92. [DOI] [PMC free article] [PubMed] [Google Scholar]
- 42.Dull T, et al. A third-generation lentivirus vector with a conditional packaging system. Journal of virology. 1998;72:8463–8471. doi: 10.1128/jvi.72.11.8463-8471.1998. [DOI] [PMC free article] [PubMed] [Google Scholar]
- 43.Petti LM, Ray FA. Transformation of mortal human fibroblasts and activation of a growth inhibitory pathway by the bovine papillomavirus E5 oncoprotein. Cell growth & differentiation : the molecular biology journal of the American Association for Cancer Research. 2000;11:395–408. [PubMed] [Google Scholar]
- 44.Stewart SA, et al. Lentivirus-delivered stable gene silencing by RNAi in primary cells. RNA (New York, N.Y) 2003;9:493–501. doi: 10.1261/rna.2192803. [DOI] [PMC free article] [PubMed] [Google Scholar]
- 45.Thery C, Amigorena S, Raposo G, Clayton A. Isolation and characterization of exosomes from cell culture supernatants and biological fluids. Current protocols in cell biology/editorial board, Juan S. Bonifacino … [et al.] 2006 doi: 10.1002/0471143030.cb0322s30. Chapter 3, Unit 3.22. [DOI] [PubMed] [Google Scholar]
- 46.Dueck A, Eichner A, Sixt M, Meister G. A miR-155-dependent microRNA hierarchy in dendritic cell maturation and macrophage activation. FEBS letters. 2014;588:632–640. doi: 10.1016/j.febslet.2014.01.009. [DOI] [PubMed] [Google Scholar]
- 47.Meyer LR, et al. The UCSC Genome Browser database: extensions and updates 2013. Nucleic acids research. 2013;41:D64–69. doi: 10.1093/nar/gks1048. [DOI] [PMC free article] [PubMed] [Google Scholar]
- 48.Yang YH, Buckley MJ, Speed TP. Analysis of cDNA microarray images. Briefings in bioinformatics. 2001;2:341–349. doi: 10.1093/bib/2.4.341. [DOI] [PubMed] [Google Scholar]
- 49.Yang YH, et al. Normalization for cDNA microarray data: a robust composite method addressing single and multiple slide systematic variation. Nucleic acids research. 2002;30:e15. doi: 10.1093/nar/30.4.e15. [DOI] [PMC free article] [PubMed] [Google Scholar]
- 50.Khojasteh M, Lam WL, Ward RK, MacAulay C. A stepwise framework for the normalization of array CGH data. BMC bioinformatics. 2005;6:274. doi: 10.1186/1471-2105-6-274. [DOI] [PMC free article] [PubMed] [Google Scholar]
- 51.Smyth GK, Speed T. Normalization of cDNA microarray data. Methods (San Diego, Calif) 2003;31:265–273. doi: 10.1016/s1046-2023(03)00155-5. [DOI] [PubMed] [Google Scholar]
- 52.Ritchie ME, et al. limma powers differential expression analyses for RNA-sequencing and microarray studies. Nucleic acids research. 2015;43:e47. doi: 10.1093/nar/gkv007. [DOI] [PMC free article] [PubMed] [Google Scholar]
- 53.Marioni JC, et al. Breaking the waves: improved detection of copy number variation from microarray-based comparative genomic hybridization. Genome biology. 2007;8:R228. doi: 10.1186/gb-2007-8-10-r228. [DOI] [PMC free article] [PubMed] [Google Scholar]
- 54.Venkatraman ES, Olshen AB. A faster circular binary segmentation algorithm for the analysis of array CGH data. Bioinformatics (Oxford, England) 2007;23:657–663. doi: 10.1093/bioinformatics/btl646. [DOI] [PubMed] [Google Scholar]
- 55.Mermel CH, et al. GISTIC2.0 facilitates sensitive and confident localization of the targets of focal somatic copy-number alteration in human cancers. Genome biology. 2011;12:R41. doi: 10.1186/gb-2011-12-4-r41. [DOI] [PMC free article] [PubMed] [Google Scholar]
- 56.Klein CA, et al. Comparative genomic hybridization, loss of heterozygosity, and DNA sequence analysis of single cells. Proceedings of the National Academy of Sciences of the United States of America. 1999;96:4494–4499. doi: 10.1073/pnas.96.8.4494. [DOI] [PMC free article] [PubMed] [Google Scholar]
Associated Data
This section collects any data citations, data availability statements, or supplementary materials included in this article.
Supplementary Materials
Data Availability Statement
The miRNA-seq data and microarray data are deposited at the GEO database under accession numbers GSE68683. Analysed data for microarray and miRNAs can be found in supplementary file 1 and 2 respectively. The mouse aCGH data are deposited at the GEO database under accession number GSE87469. All raw data for presented graphs and statistics deposited in source data files. Further material and data more than what is presented here can be obtained from the corresponding author (Christoph A Klein) upon request.