

Abstract
Chromatin immunoprecipitation (ChIP) is a powerful assay used to probe DNA–protein interactions. Traditional methods of implementing this assay are lengthy, cumbersome and require a large number of cells, making it difficult to study rare cell types such as certain cancer and stem cells. We have designed a microfluidic device to perform sensitive ChIP analysis on low cell numbers in a rapid, automated fashion while preserving the specificity of the assay. Comparing ChIP results for two modified histone protein targets, we showed our automated microfluidic ChIP (AutoChIP) from 2,000 cells to be comparable to that of conventional ChIP methods using 50,000–500,000 cells. This technology may provide a solution to the need for a high sensitivity, rapid, and automated ChIP assay, and in doing so facilitate the use of ChIP for many interesting and valuable applications.
Introduction
Protein–DNA interactions are responsible for numerous critical cellular events: for example, gene expression and silencing are mediated by transcription factor protein binding and histone protein modifications, and DNA replication and repair rely on site specific protein binding. Recently it was demonstrated that combinatorial protein–DNA interactions are also responsible for conferring pluripotency in stem cells1 and tumorigenicity in cancer and cancer stem cells.2 These are subjects of immense interest to the medical and biological fields.
Chromatin immunoprecipitation (ChIP) is a powerful technique for interrogating protein–DNA interactions.3 Briefly, antibodies against the proteins of interest are used to purify these proteins along with the DNA they bind to. Subsequently this DNA can be released, identified and quantified, giving information about where the protein binds across the genome. However, two critical drawbacks preclude the use of ChIP in many applications. First, established ChIP protocols require large numbers of cells (105–107). This restricts their use on primary tissue samples such as primary patient tumors and biopsies, and on rare cell types such as cancer stem cells, which only yield on the order of 103–104 cells. Second, the assays are lengthy (2–7 days) and cumbersome to perform. Consequently, the quality of the data obtained varies according to the skill and experience of the user. There has been considerable effort and some progress in addressing these issues, but to date it has not been possible to address all of the drawbacks of ChIP simultaneously: that is, to have an assay that works on small numbers of cells, is rapid, and is sufficiently robust that it does not require highly skilled hands.4-7
We have developed a microfluidic chip and automated system for performing ChIP assays (AutoChIP). Taking advantage of on-chip valve actuated active mixing8,9 we significantly shortened the key incubation step in ChIP from overnight to 2 h, thus reducing the length of the assay to less than a day. The automation aspect of the microfluidic system allows even ChIP technique novices to perform effective ChIP assays. Once the cells are fixed, no manual manipulation of the samples is required until the immunoprecipitated DNA is ready for PCR analysis, which greatly reduces the demand for user expertise and experience in sample handling. The device performs four parallel ChIP measurements using 2,000 cells per measurement. As a proof of concept, we performed ChIP of two modified histone proteins on mouse erythroleukemic (MEL) cells using AutoChIP, and showed that our results are comparable to that of traditional ChIP using larger samples. This demonstrates the ability of the system to perform ChIP on low cell numbers, while simplifying and shortening the process, making ChIP accessible for more applications and people.
Materials and methods
Device fabrication and operation
The device is made of polydimethylsiloxane (PDMS), contains channels and valves, and is fabricated as detailed previously10 with some modifications. The hybrid flow master molds were fabricated out of 45 μm AZ-50XT (Mays Chemicals) and 35 μm SU8-50 photoresists (Microchem), and the control molds were cast from 35 μm SU8-2025 (Microchem). For the PDMS control layer, 20 g of uncured PDMS (20 Part A : 1 Part B) was spun onto the negative mold at 1,500 rpm for 60 s. Cross-sectional dimensions of the control channels are 35 μm × 300 μm. For the PDMS flow layer, 40 g of uncured PDMS (5 Part A : 1 Part B) was poured onto the negative mold, degassed for 1 h and baked for 1 h at 80 °C to cure. Cross-sectional dimensions of the flow channels are 45 μm × 300 μm at rounded valves and 35 μm × 300 μm otherwise. The ring structures of the device are 7500 μm in length and 3800 mm in width (from outer edge to outer edge). Actuation and operation of the device is also as previously described.10 An image and schematic of the device is shown in Fig. 1 and Fig. 2.
Fig. 1.

Image of the microfluidic ChIP device. The device contains 46 valves and has four parallel ChIP reactors fed from a single cell source.
Fig. 2.
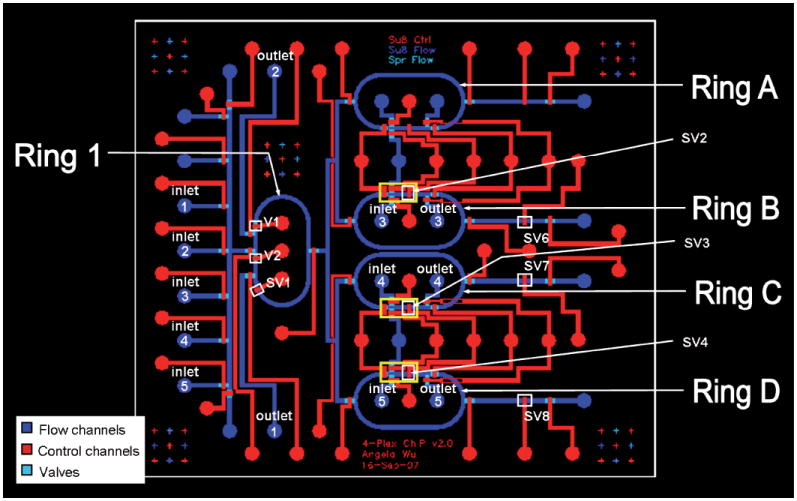
AutoCAD schematic of the microfluidic device. Reagent-containing flow channels are shown in blue shades, and valve-actuating control channels in red. In Ring 1, fixed cells are trapped, lysed and the DNA is fragmented. Antibody-bead preparations are loaded into Rings A to D and mixed with fragmented DNA using valve actuated active mixing to facilitate IP. After IP, the samples are washed in the columns stacked behind sieve valves SV6, SV7 and SV8, and collected from the device. All fluids are driven by pneumatic, non-pulsatile pressure at 10 psi.
Cell culture
BB88 mouse erythroleukemic cells (MEL cells) (ATCC) were grown to confluency in RPMI-1640 media supplemented with l-glutamine (GIBCO), 10% fetal bovine serum (GIBCO), and 1× pen-strep (GIBCO), and under 37 °C and 5% CO2 incubator conditions. Cells were passaged every two days to maintain a concentration of ~1 to 2 × 10⁶ mL−1.
Conventional ChIP assay
Conventional ChIP was performed as described in a previous publication12 on 50,000 or 500,000 MEL cells. Fig. 3 illustrates the conventional ChIP process flow. First the cells to be analyzed are fixed with formaldehyde in order to crosslink DNA to proteins. The cells are subsequently lysed to release the chromatin. The DNA is then fragmented either by sonication or enzymatic digestion. The fragmented DNA is then incubated at 4 °C overnight with beads that have been functionalized with an antibody against the protein of interest. During this incubation period, or immunoprecipitation (IP) step, the antibody will capture the protein of interest along with the DNA to which this protein is crosslinked. Finally, the beads are washed to remove non-specifically bound products, the DNA then released from the protein–bead complex, and subsequently purified. The purified DNA is then analyzed via various methods. Due to the need for several long incubations, conventional bench top ChIP can typically take from 2 days up to 1 week.
Fig. 3.

A schematic of the ChIP process flow and illustration of how gene enrichment is determined for ChIP.
Microfluidic ChIP assay (AutoChIP)
Fig. 2 shows a labeled schematic of the device where different stages of ChIP are performed.
Cell and DNA processing
Before each experiment, the inside surface of the device is treated with 0.2% pluronic solution (0.2% w/v cell culture grade Pluronic F127 (Sigma) in DPBS (Dulbecco’s Phosphate Buffered Saline) (GIBCO)) for 15 min, followed by rinsing with DPBS and air drying. During device treatment, confluent MEL cells are taken from culture and resuspended in DPBS to a concentration of 2 × 10⁵ mL−1. The cells are then fixed by adding 111 μL of 10% formaldehyde to 1 mL of cells for 10 min. Fixing was stopped by adding 123 μL of 1.25 M glycine. Subsequently, 40 μL of fixed cells, which is a total of ~8,000 cells, was mixed with 5 μL of beads (15 μm diameter, PMMA, washed and filtered (Bangs Labs)) at 500 μL−1 concentration. The cell/bead slurry is then loaded into the microfluidic device by flowing them through inlet 1 directly into Ring 1. All steps described henceforth in this section are performed using on-chip actuators, without any manual manipulation of the samples by the user. Sieve valve SV1 allows only fluid to pass and retains solids, thus allowing all cells and beads to be stacked in the ring, effectively concentrating all cells from a 40 μL volume into less than 400 nL.10 Since cells are deformable, cells alone are prone to ‘squeeze’ into the spaces in the sieve valve, leading to blockage of flow. The PMMA beads forms a matrix like structure which allows cells to rest in the spacing between beads without blocking the flow. The cells/beads are then briefly rinsed by flowing DPBS into Ring 1 over the stacked column. All excess fluids exit Ring 1 via outlet 1.
Cell lysis and DNA fragmentation via enzymatic digestion is also performed in Ring 1. By keeping valves V1 and V2 closed, the portion of Ring 1 between those valves is filled with NP40 buffer (100 mM Tris pH 8, 100 mM NaCl, 30 mM MgCl2, 100 mM CaCl2, 5% Igepal CA-630 (Sigma)) by flowing the buffer from inlet 2 to outlet 2. Following this, all valves are closed and the cells/beads in Ring 1 are mixed with the NP40 buffer for 10 mins via peristaltic pumping.8 During this time, the cells are permeabilized by the buffer. After permeabilization, the process is repeated to load Micrococcal Nuclease enzyme (MNase, 0.5 units μL−1 in DPBS (Roche)) into Ring 1 from inlet 3. The permeabilized cells/beads are mixed with MNase for 10 mins to allow the MNase to enzymatically digest the DNA into fragments. Although at this point the cells have not been lysed, permeabilization with NP40 allows MNase to enter the nucleus and gain access to the DNA. Immediately after digestion, SDS/EDTA lysis buffer (10% w/v SDS, 250 mM EDTA) is loaded into Ring 1 in the same manner as the other two reagents from inlet 4, and mixed with the cell/bead slurry for 5 mins. This has two effects: first, to stop DNA digestion by inactivating the MNase with EDTA, and second, to lyse the cells completely with SDS to release the fragmented DNA. This step must be performed promptly after MNase digestion to avoid overdigestion of DNA. Note that when loading the MNase and SDS/EDTA lysis buffer into Ring 1, the ring is already completely filled with cells/beads, so some of the cell/bead slurry must be expelled from Ring 1 to outlet 2 to make room for the incoming reagents. Each time, ~10% of the material orginally in Ring 1 is lost, resulting in an overall reduction to ~80% of the initial number of cells loaded onto the device, or a final count of ~6,400 cell equivalents.
Immunoprecipitation and wash
Rings B to D are pre-loaded with antibody-functionalized beads (Protein A Dynabeads (Invitrogen) with antibodies) between the two valves in the yellow boxed regions shown in Fig. 2, by flowing beads through inlets 3, 4, 5 to outlets 3, 4, 5. Sieve valves SV2, SV3, SV4 trap the beads to make a bead column. Ring A is not loaded with any beads, but rather used as a reference sample of input DNA that has not undergone any IP. Ring B is loaded with Rabbit IgG beads (Millipore Upstate) for the mock IP negative control. Rings C and D are replicates, both loaded with either anti-H3K4m3 (Abcam) or anti-AcH3 (Millipore Upstate). The IP-ready material is flushed into Rings A to D by flowing DPBS/PIC (Protease Inhibitor Cocktail (Roche) diluted to 1 × concentration in DPBS immediately before use) from inlet 5, dividing the cellular material into four equal parts of ~1,600 cell equivalents per ring. No outlets are opened in this step, so that the rings can be “dead-end filled” with all the cellular material; opening outlets will result in loss of soluble DNA. Dead-end filling is possible because PDMS is gas permeable; in a matter of minutes the air in the rings is expelled and replaced by liquid. During IP, the antibody-beads are mixed with the cellular material for 2 h, and the device is placed on an ice block. The entire setup is placed in a polystyrene enclosure in this step to maintain an IP temperature close to 4 °C.
After IP, the contents of Ring A are eluted in DPBS directly into a microcentrifuge tube without any wash as the input control. In the other rings, the beads are re-stacked in a column behind sieve valves SV6, SV7, SV8, and washed for 90 s with each of four increasingly stringent buffers (Millipore Upstate): Low salt buffer (0.1% SDS, 1% Triton X-100, 2 mM EDTA, 20 mM Tris-HCl pH 8.1, 150 mM NaCl), High salt buffer (0.1% SDS, 1% Triton X-100, 2 mM EDTA, 20 mM Tris-HCl pH 8.1, 500 mM NaCl), LiCl buffer (0.25 M LiCl, 1% NP40, 1% deoxycholate, 1 mM EDTA, 10 mM Tris-HCl pH 8.1), and TE (10 mM Tris-HCl, 1 mM EDTA pH 8.0). When washing, the pneumatic pressure on the wash buffers is adjusted to 5 psi to better control wash volume. A lower pressure also prevents specifically bound materials from being stripped off the antibodies under high shear forces and lost.
The washed beads are eluted from the device by outlets 3, 4, 5, 6 into microcentrifuge tubes and boiled at 100 °C for 30 mins to release the DNA. The supernatant is then subjected to real time quantitative polymerase chain reaction (qPCR) analysis.
Linear pre-amplification and real-time qPCR
To increase the amount of detectable material, multiplex PCR was used to simultaneously pre-amplify β-actin and β-H1 in each sample, including input and genomic PCR controls, with the following primers (0.1 μM, IDT):
β-actin Forward 5′-AGATTCTTTGACAAGTTTGGA-3′
β-actin Reverse 5′-AGGATGTCAGCACTTTCTTG-3′
β-H1 Forward 5′-GACCTCTATGCCAACACAGT-3′
β-H1 Reverse 5′-GCCAGAGCAGTAATCTCCTT-3′
These primers result in product sizes of 94-bp and 89-bp respectively. The following thermal cycling profile was used on a thermocycler (MJ Research): Hot start 95 °C for 3 min, followed by 15 cycles of 95 °C for 15 s, 52 °C for 30 s, 60 °C for 30 s. Standard commercial PCR master mix was used (iQ PCR Supermix (Bio-Rad)). The limited number of PCR cycles ensures that pre-amplification is linear, avoiding reagent depletion effects on PCR efficiency. The low primer concentration reduces primer dimer product formation. Both ensure there is no resulting distortion in quantitative product representation.11
After pre-amplification, the material was diluted ten-fold in water to quench the reaction, and the diluted material was used for real-time qPCR. All real-time qPCR reactions were performed using Taqman probes (IDT) in a Chromo4 thermocycler (MJ Research, Bio-Rad), with the exception of one H3K4m3 replicate, in which SYBR GreenER dye (Invitrogen) was used instead. The Taqman probe sequences were as follows:
β-actin 5′-TCTCTTCTGCCCTGGCCATC-3′
β-H1 5′-TGCATCCTGTCAGCAATGCC-3′
The same end primers and cycling profile as above were used. Primer and probe concentrations were 0.5 μM. For the reaction using SYBR green, post-run melt curve analysis was used to confirm that all products formed were full length and not primer dimers.
Results and discussion
Histones are proteins around which DNA is wrapped; together, they form chromatin. Modifications such as methylation and acetylation can occur on different types of histones at different locations, and act as markers for nuclear processes including gene transcription and DNA repair. We selected two proteins of interest as targets in our proof-of-principle experiments because of their relative abundance in the cell: Trimethylated-lysine-4-on-histone-3 (H3K4m3) and acetylated-histone-3 (AcH3). We performed separate AutoChIP assays on 2,000 fixed MEL cells with each antibody of choice. Briefly, fixed cells were loaded onto the device, lysed and the DNA was fragmented via enzymatic digestion in Ring 1.
IP was performed in Rings A to D and then washed and eluted off the device for analysis. During IP, Ring A was not pre-loaded with any antibody functionalized beads but instead used as a reference sample of input DNA that had not undergone any IP. Ring B was pre-loaded with beads coated with IgG and used as negative control against nonspecific binding of DNA because IgG should not specifically bind any protein. Both controls in Rings A and B were consistent with standard bench top ChIP controls. Rings C and D contained beads coated with the antibody against the protein of interest (either anti-H3K4m3 or anti-AcH3).
To evaluate the results, the eluted DNA from these ChIP experiments was then amplified via multiplex PCR and finally qPCR was used to determine the amount of enrichment of our chosen genes. Enrichment is essentially the ratio between the quantity of a given gene found after IP, and the quantity of that same gene in the input reference sample (from Ring A) which has not undergone IP (Fig. 3). In other words, it represents how much of the gene was pulled down by the antibody compared to the detectable amount of that gene in the whole genome. In our data, enrichment is calculated as the percentage precipitated relative to input. To calculate this percentage, the following formula was used:
where QIP and Qinput are the qPCR measured quantities of the given gene in the IP and input samples respectively, in units of ng/μL, Ninput is the number of cells used to generate the input, and NIP is the number of cells undergoing IP.
We chose two genomic regions of interest to measure AutoChIP specificity: promoter regions of the β-actin and β-H1 genes, which should be differentially associated with the H3K4m3 and AcH3 signatures. Both have been previously studied and have published data available for comparison.12 As reference, conventional bench-top ChIPs were also done independently with the same antibodies and cell lines.
Fig. 4a compares the performance of AutoChIP with a bench top protocol12 for H3K4m3 using 50,000 cells. Results from the conventional protocol (Fig. 4a) showed that β-actin was highly enriched whereas β-H1 was not, and this trend was replicated in the AutoChIP results (Fig. 4b). In addition, published data also confirms the validity of AutoChIP results.12 H3K4m3 is a known marker for transcriptional activity, so a ubiquitously expressed gene like β-actin should be highly enriched by this protein, and our result confirmed this.
Fig. 4.

Bar graphs comparing conventional ChIP assay and our AutoChIP assay. Quantitative PCR (qPCR) was used to determine DNA amount in each assay. The qPCR data was converted to an absolute DNA amount using a standard curve. Next, to normalize, the amount of DNA was ratioed to a whole genomic DNA sample (the ‘input’ sample) that was generated in parallel, but without IP. (a) Results using anti-H3K4m3. In the conventional assay results with fifty-thousand BB88 MEL cells, β-actin is shown to be positively associated with H3K4m3 whereas β-H1 is not associated with H3K4m3. (b) Results using anti-H3K4m3. AutoChIP assay results (averaged from three replicates) with 2,000 cells largely replicates profiles generated by conventional assay in (a) both qualitatively and quantitatively. (c) Results using anti-AcH3. Conventional assay results with five-hundred-thousand BB88 MEL cells shows both b-actin and b-H1 to be enriched by AcH3, relative to IgG isotype control. (d) Results using anti-AcH3. AutoChIP assay results with 2,000 cells (averaged from six replicates) qualitatively replicate the trends shown in conventional assay results in (c). Note that the level of AcH3-bound β-H1 was much lower in the AutoChIP assay than the level of AcH3-bound β-actin in the bench top assay, a trend that was observed in all six experimental replicates. The higher level of enrichment detected using AutoChIP may be due to improved antibody–chromatin interactions facilitated by a smaller reaction volume, hence leading to a higher IP efficiency for both β-actin and β-H1. The IP efficiency did not increase proportionally for β-actin in the AutoChIP assay because most likely it is already saturated. Error bars in (b) and (d) indicate standard error.
Fig. 4b compares the performance of the AutoChIP assay with a bench top protocol for AcH3 using 500,000 cells. In the bench top assay, both β-actin and β-H1 were AcH3-enriched (Fig. 4c) and this trend was again replicated in the AutoChIP assays (Fig. 4d). Note that the level of AcH3-bound β-H1 was higher in the AutoChIP assay than the level of AcH3-bound β-actin in the bench top assay, and this trend was observed in all six experimental replicates that were performed using AutoChIP. The higher level of enrichment detected using AutoChIP may be due to improved antibody–chromatin interactions facilitated by a smaller reaction volume, hence leading to a higher IP efficiency for both β-actin and β-H1. The IP efficiency did not increase proportionally for β-actin in the AutoChIP assay because most likely it is already saturated at 60–70% relative to input.
Consistent with that of other publications on ChIP with low cell numbers,7,12,13 in both sets of data we noticed that the relative background level (i.e. the enrichment by IgG, which should be a negative control) was higher in AutoChIP than in the conventional ChIP. However, the overall IP efficiency, as indicated by the percent precipitated relative to input, improved as well. There are two possible explanations for these observations. First, the concentration of cell lysate and antibody during IP is higher in AutoChIP than in the bench top assay. In the bench top assays, IP was performed in ~1 mL scale volumes, whereas in AutoChIP the IP volume is 400 μL. The quantity of antibodies used for both AutoChIP and bench top assays was the same. Thus, from Fig. 4c to 4d, the reduction in cell number is ~20× whereas the reduction in volume is ~1000×, giving an overall increase in cell lysate concentration of ~50× and overall increase in antibody concentration of ~1000×. This also means that the relative ratio of antibody to cell lysate is increased. These higher concentrations may increase the efficacy of antibody–chromatin interactions, explaining the overall increase in IP efficiency. Interestingly, from Fig. 4a to 4b, the overall increase in cell lysate concentration is only ~5×, and the improvement in IP efficiency was not as dramatic. Second, the relative increase in antibody to cell lysate ratio reduces the probability of antibody saturation, and more background is expected. This was also noted in other ChIP publications using small cell numbers. Nonetheless, the overall gene enrichment profiles shown in the bench top assays were preserved in AutoChIP, and the increased background did not affect the interpretation of the results.
A major improvement of AutoChIP over the conventional protocol is the significantly shorter time it takes to run each assay. In the conventional protocol, the longest step is the overnight IP incubation at 4 °C. We reduced this step to 2 h without losing specificity of the ChIP assay in identifying differential histone modification profiles, and this is possible for two reasons. First, we use pumps in the device to actively mix the reagents and beads in the IP chamber during incubation, which accelerates the achievement of steady-state antibody–protein binding. Second, as already mentioned, the reaction volume in the microfluidic IP chamber is only ~400 nL (compared with ~1 ml) on the bench top). This creates a high concentration of target protein, which leads to a higher effective rate of antibody–protein binding. By the same principle, other incubation steps are also shortened for our protocol. Using AutoChIP, a single researcher has been able to perform up to three independent ChIP studies in one day, starting from cells to completed qPCR data, whereas using conventional ChIP protocols, three such studies would typically take three days.
Another advantage of AutoChIP is its parallel process. The current microfluidic device is designed with only four rings to accommodate four ChIP reactions at one time. Including two control reactions, this allows for two specific antibody reactions in 7 h. Scaling up can be easily accomplished by fabricating a chip with more mixing rings for even more parallel reactions.
Automation is one of the biggest benefits of using micro-fluidics. Not only does it facilitate a high throughput rate, but at the same time helps to standardize and simplify the ChIP process. For example, in the conventional protocol, the washing step after IP is critical to ensure a good signal to noise ratio in the data. While washing, it is important to remove only the buffer and not any of the beads, so the effectiveness of the wash is highly dependent on the user’s skill level. Microfluidic sieve valves, by allowing flow through of fluids but not beads,10,14 help to automate and simplify the wash process so that the user only has to change the buffer being used. Automation also eliminates the need for pipetting and in doing so reduces variation in reaction volumes from pipetting errors. A smaller surface area inside the chip compared to a microcentrifuge tube also means reduced material loss by adsorption to the sidewalls. All in all, these improvements reduce the dependency on user technique, making ChIP a less daunting task for beginners and an easier one for experts.
Conclusions
We have designed a microfluidic device along with a semi-automated system for doing chromatin immunoprecipitation assays rapidly on a very low number of cells. As a proof-of-concept, we demonstrated the ability of this system to faithfully reproduce the histone modification profiles that were generated using conventional protocols while using only 2,000 cells, and decreasing the amount of time required for each assay. We hope this transition to an automated platform will make this assay accessible to more users of all experience levels. We also hope that our efforts to scale down the required cell numbers will make ChIP feasible for rare cell type applications such as cancer and stem cell research.
Acknowledgments
The authors thank R. Gomez for help with construction of microfluidic actuation manifolds; A. Leyrat for guidance in cell culture techniques; A. Potanina for device fabrication; L. Warren and C. Fan for advice on PCR. This work has been supported by NCI and Pioneer grants, as well as the Bio-X Foundation Fellowship.
References
- 1.Yu J, et al. Science. 2007;318:1917. doi: 10.1126/science.1151526. [DOI] [PubMed] [Google Scholar]; Takahashi K, et al. Cell. 2007;131:1. [Google Scholar]
- 2.Jones PA, Baylin SB. Nat Rev Genetics. 2002;3:415. doi: 10.1038/nrg816. [DOI] [PubMed] [Google Scholar]
- 3.Solomon MJ, Larsen PL, Varshavsky A. Cell. 1988;53:937. doi: 10.1016/s0092-8674(88)90469-2. [DOI] [PubMed] [Google Scholar]; Dedon PC, Soults JA, Allis CD, Gorovsky MA. Anal Biochem. 1991;197:83. doi: 10.1016/0003-2697(91)90359-2. [DOI] [PubMed] [Google Scholar]
- 4.Acevedo LG, et al. Biotechniques. 2007;43:791. doi: 10.2144/000112625. [DOI] [PMC free article] [PubMed] [Google Scholar]
- 5.Nelson JD, Denisenko O, Bomsztyk K. Nat Protocols. 2006;1:179. doi: 10.1038/nprot.2006.27. [DOI] [PubMed] [Google Scholar]; Flanagin S, Nelson JD, Castner DG, Denisenko O, Bomsztyk K. Nucleic Acids Res. 2008;36:e17. doi: 10.1093/nar/gkn001. [DOI] [PMC free article] [PubMed] [Google Scholar]
- 6.O’Neill LP, VerMilyea MD, Turner BM. Nat Genetics. 2006;38:835. doi: 10.1038/ng1820. [DOI] [PubMed] [Google Scholar]
- 7.Dahl JA, Collas P. Nucleic Acids Res. 2008;36:e15. doi: 10.1093/nar/gkm1158. [DOI] [PMC free article] [PubMed] [Google Scholar]; Dahl JA, Collas P. Nat Protocols. 2008;3:1032. doi: 10.1038/nprot.2008.68. [DOI] [PubMed] [Google Scholar]
- 8.Beebe DJ, Mensing GA, Walker GM. Annual Review of Biomedical Engineering. 2002;4:261. doi: 10.1146/annurev.bioeng.4.112601.125916. [DOI] [PubMed] [Google Scholar]; Hansen C, Quake SR. Curr Opin Struct Biol. 2003;13:538. doi: 10.1016/j.sbi.2003.09.010. [DOI] [PubMed] [Google Scholar]
- 9.Chou HP, Unger MA, Quake SR. Biomed Microdevices. 2001;3:323. [Google Scholar]
- 10.Marcus JS, Anderson WF, Quake SR. Anal Chem. 2006;78:3084. doi: 10.1021/ac0519460. [DOI] [PubMed] [Google Scholar]
- 11.Peixoto A, Monteiro M, Rocha B, Veiga-Fernandes H. Genome Res. 2004;14:1938. doi: 10.1101/gr.2890204. [DOI] [PMC free article] [PubMed] [Google Scholar]; Cantor AB, Orkin SH. Curr Opin Genet Dev. 2001;11:513. doi: 10.1016/s0959-437x(00)00226-4. [DOI] [PubMed] [Google Scholar]
- 12.Attema JL, Papathanasiou P, Forsberg EC, Xu J, Smale ST, Weissman IL. Proc Natl Acad Sci USA. 2007;104:12371. doi: 10.1073/pnas.0704468104. [DOI] [PMC free article] [PubMed] [Google Scholar]
- 13.Dahl JA, Collas P. Stem Cells. 2007;25:1037. doi: 10.1634/stemcells.2006-0430. [DOI] [PubMed] [Google Scholar]
- 14.Melin J, Quake SR. Annu Rev Biophys Biomol Struct. 2007;36:213. doi: 10.1146/annurev.biophys.36.040306.132646. [DOI] [PubMed] [Google Scholar]