
Figure 1.
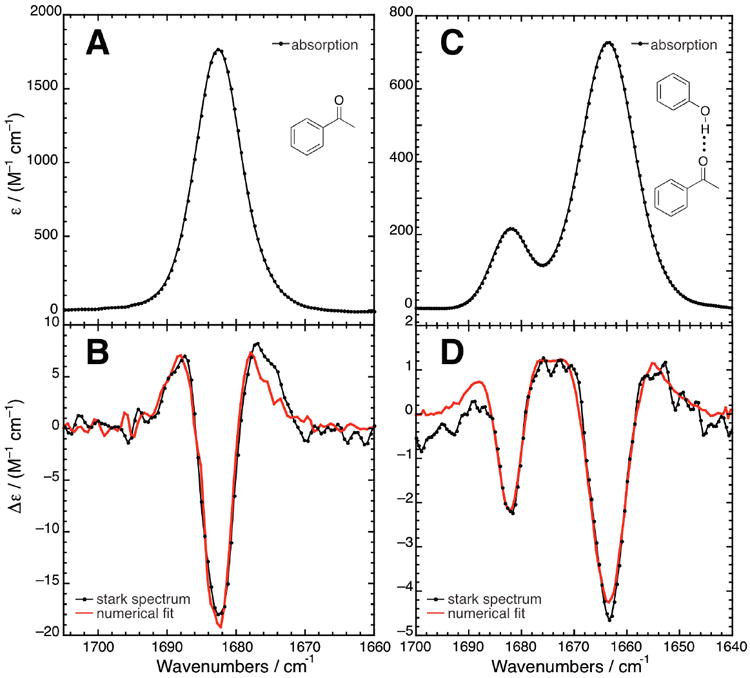
Vibrational Stark spectroscopy of the C=O stretch. Absorption (A, C) and Stark (B, D) spectra of acetophenone (50 mM) at 77 K in 2-methyltetrahydrofuran (A, B) and in toluene with 1.25 equivalents of phenol (C, D). Stark spectra are recorded at several applied fields from 0.5–1.4 MV/cm, but are scaled to 1 MV/cm here for comparison (note that the Stark signal scales with the square of the external field33). In the Stark spectra, the black dots and trace is the experimental data and the red trace is a numerical fit, (consisting of contributions of the 0th, 1st, and 2nd derivatives of the absorption) from which Stark parameters are extracted (see Table 1).