
Figure 2. Distribution of Corrected Serum Calcium and MCPT Among All Subjects (n=1194).
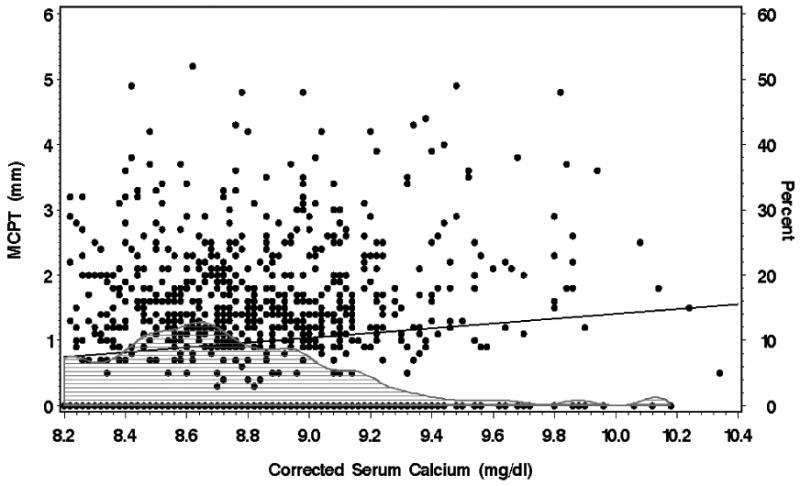
The regression line reflects the overall relationship between corrected calcium and MCPT (maximal carotid plaque thickness), in subjects both with and without plaque (r = +0.12, p <0.001). The shaded area specifies the percent of subjects without plaque (using the right axis) at each level of corrected calcium. To convert corrected serum calcium to mmol/L, multiply by 0.25.