
Figure 4. Transcriptional Regulatory Motifs in Human ES Cells.
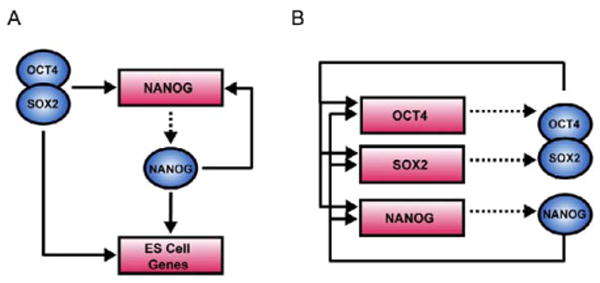
(A) An example of feedforward transcriptional regulatory circuitry in human ES cells. Regulators are represented by blue circles; gene promoters are represented by red rectangles. Binding of a regulator to a promoter is indicated by a solid arrow. Genes encoding regulators are linked to their respective regulators by dashed arrows.
(B) The interconnected autoregulatory loop formed by OCT4, SOX2, and NANOG.