

Abstract
Background
Among older adults, loss of mobility represents a critical stage in the disablement process, whereby the risk for disability is significantly increased. Physical activity is a modifiable risk factor that is associated with reduced risk of losing mobility in older adulthood; however, few studies have examined physical activity performed earlier in life in relation to mobility later in life.
Methods
Data from a population-based study of 1155 adults aged 65 years and older living in the Chianti region of Italy in 1998–2000 were analyzed in 2005 and 2006. Participants retrospectively recalled their physical activity levels in midlife and underwent mobility testing and medical examination. Two objective mobility outcomes were examined as a function of past physical activity: the Short Physical Performance Battery (SPPB) and the ability to walk 400 meters.
Results
Older Italian adults (mean age 74.8, standard deviation 7.3) who engaged in higher levels of physical activity in midlife were significantly more likely to perform better on the SPPB than individuals who were less physically active in midlife. In addition, failure to complete the 400-meter walk test was significantly less likely among physically active men (Level II) (odds ratio [OR]=0.37, 95% confidence interval [CI]=0.15–0.93) and very active men (Level III) (OR=0.23, 95% CI=0.09–0.63) when compared to men who were less active (Level I) in the past (p for trend, 0.008). These associations remained after adjustment for demographic factors, medical conditions, and physiologic impairments.
Conclusions
Older adults who reported higher levels of physical activity in midlife had better mobility in old age than less physically active ones.
Introduction
Mobility influences myriad aspects of everyday functioning from performing activities of daily living to facilitating social interaction. Mobility is defined as the ability to walk safely and independently. Loss of mobility in older ages represents a critical stage in the disablement process, whereby the risk for disability and mortality is significantly increased.1,2 Given the demographic reality of global population aging, it is imperative to investigate modifiable factors that might help preserve mobility in later life.
Physical activity is widely promoted to prevent adverse health outcomes. Indeed, there is growing evidence that older adults who engage in physical activity are more likely to experience better physical function and longer active life expectancy compared to sedentary older adults.3-5 Even older women with limitations in activities of daily living who walk at least eight blocks per week are better able to maintain their mobility than those who do not get outside their homes to walk.6 Further, sedentary older adults who become physically active have a lower risk of death relative to those who remain sedentary in old age.7,8 In addition to behavioral practices in old age, physical activity in midlife is associated with reduced risk for morbidities that might affect mobility in late life, such as coronary heart disease, diabetes, and certain cancers.9-11 However, it is unclear whether physical activity performed in midlife is associated with mobility in older adulthood. Therefore, the aims of the current study were to test associations of past physical activity levels in midlife with objective measures of mobility in old age, to assess the robustness of these associations by adjusting for medical conditions and physiologic impairments, and finally to determine whether midlife physical activity conferred any benefit on current mobility among older adults who had relatively low levels of physical activity over the past year.
Methods
Study Population
The InCHIANTI Study is a probability sample of 1155 community-dwelling adults aged ≥65 years living in two Italian communities: Greve in Chianti and Bagno a Ripoli.12 Among those originally sampled between September 1998 and March 2000, 91.6% of older adults agreed to participate in the study. All subjects were interviewed in their homes, and 1026 underwent a comprehensive medical examination and mobility evaluation at a local clinical center. However, 20 subjects were missing data for one of the mobility outcomes examined in this study (Short Physical Performance Battery [SPPB]) while another 58 subjects were missing for the 400-meter walk test (see Measures section) because they either refused to participate or were ineligible due to exclusion criteria. Those with missing mobility data were significantly (p<0.05) more likely to be older, less physically active, and have more medical conditions than subjects with complete data; no differences by gender or education were observed. In addition, six subjects did not report their physical activity level. The analytic sample was ultimately restricted to 1001 elderly subjects with data available on physical activity and mobility outcomes.
Measures
Physical activity
Physical activity (defined as any bodily movement produced by skeletal muscles that results in an expenditure of energy13) was assessed through an interviewer-administered questionnaire. Subjects were asked to indicate their average level of physical activity during three age periods in life: 20 to 40 years, 40 to 60 years, and the past year. One of the following five response categories that incorporates duration, frequency, and intensity of physical activity could be chosen for each age period: (1) minimal physical activity, (2) light physical activity performed 2 to 4 hours per week not accompanied by sweating (e.g., walking), (3) moderate physical activity performed 1 to 2 hours per week accompanied by sweating or light physical activity not accompanied by sweating for >4 hours per week, (4) moderate physical activity performed ≥3 hours per week accompanied by sweating, and (5) physical exercise performed regularly that required maximal strength and endurance several times per week. The reliability and validity of this physical activity assessment has not been established.
In order to obtain stable estimates of effect and to approximate recommended levels of physical activity by the U.S. Department of Health and Human Services (DHHS), the five categories of self-reported physical activity were collapsed into three levels: Level I combined the first two categories reflecting insufficient physical activity, Level II was defined by the third category, nearly meeting recommended levels of moderate physical activity, and Level III combined the last two categories, exceeding DHHS recommendations.14 The DHHS recommendations for adults are to engage in either moderate-intensity physical activities for ≥30 minutes on ≥5 days per week or vigorous-intensity physical activity on ≥3 days per week for ≥20 minutes per occasion.14 A lifetime index of physical activity to age 60 was also calculated by summing responses to the original five physical activity categories for each of the two midlife age periods (range: 2 to 10) and classifying those with scores ≤ 5 as Level I, 6 to 7 as Level II, and ≥8 as Level III.
Mobility outcomes
Two objective performance-based tests were used to assess mobility function. The first was the Short Physical Performance Battery (SPPB) that incorporates static balance, walking, and chair-rise time into a summary measure, which has excellent 1-week test–retest reliability (intra-class correlation=0.88–0.92),15 and has been shown to predict nursing home admission, disability, and mortality.1,2 Specifically, subjects were asked to place their feet in a side-by-side, semi-tandem, and tandem balance position for 10 seconds each. Scores ranged from 0 to 4 with those unable to perform the initial side-by-side stand assigned 0 and those able to hold all three stands coded 4. Subjects were then asked to walk a distance of four meters at their usual pace. The quickest time out of two trials was analyzed. Finally, subjects were asked to rise from a chair and return to the seated position five times as quickly as possible while keeping their arms folded over their chest. Both the walking and chair-rise time tasks were each scored 1 to 4 based on quartile cut-points from normative data on community-dwelling older adults.1 Subjects who were unable to perform the task were assigned a score of 0, and therefore scores range 0 to 4 for each of these tasks. The composite SPPB score is the sum of the balance, walking, and chair-rise subscores, which ranged from 0 to 12, with higher scores reflecting better lower extremity function.
The second objective test measured the ability to walk a standard 400-meter course (20 laps of 20 meters), which predicts subsequent mobility limitations and mortality.16,17 Verbal encouragement to maintain pace was given at each lap as well as the number of laps completed. A maximum of two standing rests were permitted for <2 minutes each. Assistive devices (e.g., canes, walkers) were permitted. Participants were excluded from this test if they had any of the following conditions: pathologic electrocardiographic abnormality, systolic blood pressure >180 mmHg, diastolic blood pressure >100 mmHg, resting heart rate <40 or >135 beats per minute, anterior myocardial infarction, episodes of angina in the past 3 months, severe dementia, or poor visual acuity. The ability to complete the 400-meter walk test has perfect 1-week test–retest reliability (κ=1) in older adults.18
Other covariates
The InCHIANTI Study ascertained subjects’ medical conditions through a self-reported questionnaire and structured medical examination that included laboratory testing. Coding algorithms were applied to classify a variety of diseases.19 The total count of the following eight conditions was used in data analysis: arthritis (of the knee or hip), cancer (ICD-9 codes: 140–208), chronic obstructive pulmonary disease, coronary heart disease (angina, congestive heart failure, or myocardial infarction), diabetes, hip fracture, peripheral arterial disease, and stroke.
The measurement of physiologic subsystems associated with mobility has previously been described for the InCHIANTI Study.12 Briefly, the Mini-Mental State Examination was used to measure cognitive impairment.20 Nerve conduction velocity evaluated in the right peroneal nerve by electroneurography measured impairment of the peripheral nervous system.21 Muscle power was evaluated using a leg extensor–power rig device.22 For joint flexibility, goniometric measures of the passive range of motion of the hip and ankle were used.23 Finally, impairment of energy delivery was assessed by hemoglobin levels and the ankle-brachial index for peripheral arterial circulation.
Other factors specified in the data analysis included subject’s age, gender, and highest level of education. Cigarette-smoking behavior was assessed through survey questions that identified subjects who had never smoked in their life and estimated the total pack-years for those who had smoked. Both smoking status and intensity were examined simultaneously.24 Body mass index (BMI) (weight in kilograms divided by height in meters squared) was also calculated using measured height and weight.
Data Analysis
All analyses (performed in 2005 and 2006) were adjusted for age and stratified by gender. Linear and logistic regression models were used to test associations between physical activity in midlife and mobility outcomes in late life. A series of nested models was also estimated to determine whether medical conditions and physiologic impairments explained the association of physical activity with mobility function. In the first model (Model 1 in Table 3), each mobility outcome was regressed on the lifetime physical activity index to age 60 as well as potential confounders (age, education, smoking behavior, and BMI). Model 2 added the total number of medical conditions to Model 1 covariates, while Model 3 added physiologic impairment variables to Model 2 covariates. For comparability, only subjects with complete data for all of the explanatory variables were included in the three models (Table 3). In addition, mobility outcomes were regressed on the lifetime physical activity index among subjects who reported Level-I (low) physical activity over the past year, to determine whether higher levels of physical activity in midlife conferred benefit on mobility in those who were less physically active over the past year. Physical activity levels were dummy coded with Level I as the reference group in all regression models. To test for a trend in the association of midlife physical activity level and late life mobility, an ordinal variable representing the three levels of physical activity was used in the models.
Table 3.
Mobility outcomes in old age regressed on self-reported physical activity in midlife
| Short Physical Performance Battery |
Unable to walk 400 meters |
|||
|---|---|---|---|---|
| Men b weight (SE) | Women b weight (SE) | Men Odds ratio (95% CI) | Women Odds ratio (95% CI) | |
| MODEL 1 | ||||
| Age (years) | −0.14 (0.01)** | −0.20 (0.02)** | 1.17 (1.08–1.25)** | 1.22 (1.15–1.29)** |
| Education (years) | 0.03 (0.02) | 0.06 (0.04) | 0.89 (0.76–1.05) | 0.88 (0.74–1.05) |
| Cigarette smoking | ||||
| Ever (vs never smoker) | −0.17 (0.19) | −0.05 (0.26) | 0.94 (0.35–2.53) | 1.53 (0.45–5.15) |
| Total pack-years | −0.00 (0.00) | −0.01 (0.01) | 1.00 (0.98–1.03) | 1.05 (1.01–1.10)* |
| Body mass index (kg/m2) | −0.05 (0.03) | −0.02 (0.02) | 1.06 (0.92–1.22) | 1.14 (1.05–1.24)* |
| Lifetime physical activity to age 60 | ||||
| Level I | Reference | Reference | Reference | Reference |
| Level II | 0.34 (0.27) | 0.34 (0.22) | 0.40 (0.12–1.36) | 1.13 (0.48–2.67) |
| Level III | 0.72 (0.29)* | 0.84 (0.30)** | 0.14 (0.03–0.58)** | 0.85 (0.26–2.72) |
| p for trend | p = 0.007 | p = 0.006 | p = 0.006 | p = 0.853 |
| MODEL 2 (morbid conditions + Model 1 covariates)a | ||||
| Lifetime physical activity to age 60 | ||||
| Level I | Reference | Reference | Reference | Reference |
| Level II | 0.26 (0.26) | 0.30 (0.21) | 0.48 (0.14–1.67) | 1.16 (0.48–2.84) |
| Level III | 0.67 (0.28)* | 0.84 (0.29)** | 0.15 (0.04–0.68)* | 0.73 (0.22–2.39) |
| p for trend | p = 0.007 | p = 0.005 | p = 0.010 | p = 0.680 |
| MODEL 3 (physiologic impairments + Model 2 covariates)b | ||||
| Lifetime physical activity to age 60 | ||||
| Level I | Reference | Reference | Reference | Reference |
| Level II | 0.03 (0.24) | 0.27 (0.19) | 0.76 (0.18–3.29) | 1.16 (0.40–3.30) |
| Level III | 0.40 (0.26) | 0.90 (0.27)** | 0.22 (0.04–1.19) | 0.52 (0.13–2.08) |
| p for trend | p = 0.042 | p = 0.002 | p = 0.047 | p = 0.434 |
| Sample size | 376 | 458 | 362 | 434 |
Model 2 adjusts for Model 1 covariates as well as total number of medical conditions (includes arthritis, cancer, coronary heart disease, chronic obstructive pulmonary disease, diabetes, hip fracture, peripheral arterial disease, and stroke).
Model 3 adjusts for Model 2 covariates and the following physiologic measures: Mini-Mental State Examination, nerve conduction velocity, leg muscle power, range of motion of hip (flexor and extensor) and ankle (dorsiflexion and flexor), ankle-brachial index, and serum hemoglobin.
p < 0.05;
p < 0.01 (all bolded).
Results
The characteristics of the study sample are presented in Table 1. Fifty-six percent of the sample was composed of women and, on average, subjects were approximately 74 to 75 years old (range: 65–102 years), had a low level of formal education, and had a BMI of 27.5 kg/m2. Men were more likely to have smoked cigarettes than women, and men smoked with greater intensity and duration than women. The most prevalent (modal) category of physical activity in midlife (ages 20 to 40 and 40 to 60) was “moderate” for both men and women, although the proportion of men reporting more intense physical activity levels in midlife was higher than in women. As expected, physical activity in the past year (i.e., in older adulthood) was lower than levels reported for midlife. Finally, performance on mobility function tests was better in men than in women.
Table 1.
Study sample characteristics by gender, InCHIANTI Study, 1998–2000
| Men | Women | All subjects | |
|---|---|---|---|
| Age, M (SD) | 74.0 (7.0) | 75.4 (7.5) | 74.8 (7.3) |
| Education, M (SD) | 6.2 (3.7) | 4.7 (2.8) | 5.4 (3.3) |
| Cigarette smoking | |||
| Ever (vs never), % | 70.2 | 16.6 | 40.2 |
| Total pack-years among smokers, M (SD) | 34.0 (22.1) | 16.3 (15.3) | 29.9 (22.0) |
| Body mass index (kg/m2), M (SD) | 27.1 (3.3) | 27.8 (4.6) | 27.5 (4.1) |
| PHYSICAL ACTIVITY | |||
| 20–40 years of age, % | |||
| Sedentary/minimal | 0.5 | 0.9 | 0.7 |
| Light | 6.8 | 19.1 | 13.7 |
| Moderate | 51.8 | 58.7 | 55.6 |
| Moderate/intense | 18.9 | 14.1 | 16.2 |
| Intense/strenuous | 22.1 | 7.3 | 13.8 |
| M (SD) | 3.6 (0.9) | 3.1 (0.8) | 3.3 (0.9) |
| 40–60 years of age, % | |||
| Sedentary/minimal | 0.9 | 2.0 | 1.5 |
| Light | 11.6 | 31.7 | 22.9 |
| Moderate | 50.9 | 50.5 | 50.7 |
| Moderate/intense | 19.8 | 11.2 | 15.0 |
| Intense/strenuous | 16.8 | 4.6 | 10.0 |
| M (SD) | 3.4 (0.9) | 2.9 (0.8) | 3.1 (0.9) |
| In the past year, % | |||
| Sedentary/minimal | 13.2 | 26.9 | 20.9 |
| Light | 35.2 | 48.1 | 42.5 |
| Moderate | 44.1 | 23.0 | 32.3 |
| Moderate/intense | 6.4 | 1.8 | 3.8 |
| Intense/strenuous | 1.1 | 0.2 | 0.6 |
| M (SD) | 2.4 (0.9) | 1.9 (0.9) | 2.2 (0.9) |
| Lifetime index to age 60, % | |||
| Level I | 12.5 | 32.3 | 23.6 |
| Level II | 49.3 | 52.4 | 51.1 |
| Level III | 38.2 | 15.3 | 25.4 |
| Functional outcomes | |||
| Short Physical Performance Battery, M (SD)a | 10.4 (3.0) | 9.2 (3.4) | 9.7 (3.3) |
| Unable to walk 400 meters, %b | 11.8 | 17.6 | 15.0 |
| Sample size | 440 | 561 | 1001 |
Range 0–12, 12 = highest performance level.
n = 943 (418 men and 525 women).
M, mean; SD, standard deviation.
Figures 1 and 2 display the age-adjusted distribution of mobility outcomes for each gender by categories of the lifetime physical activity index to age 60. In Figure 1, the age-adjusted SPPB scores were, on average, half a point higher for Level-II subjects, and a little less than a full point higher for Level-III subjects relative to those with Level-I physical activity in midlife. The age-adjusted prevalence of the inability to walk 400 meters was higher among men and women who had Level-I physical activity midlife compared to those who were more physically active (Figure 2). A more-graded relationship between midlife physical activity and the prevalence of inability to walk 400 meters was observed more in men than in women. Statistical tests of association between physical activity and mobility are shown in Table 2. Higher levels of physical activity were associated with better SPPB scores in men and in women; however, statistical significance of the association was inconsistent across the two age periods in men. In contrast to findings with the SPPB, physical activity in midlife was associated with failure to complete the 400-meter walk in men but not in women. Men who were classified with Level-II or -III physical activity in midlife were more than 50% less likely to fail the 400-meter walk test in older adulthood than men who had Level-I physical activity.
Figure 1.

Age-adjusted mean Short Physical Performance Battery scores and 95% confidence-interval bars by lifetime physical activity index to age 60.
Figure 2.
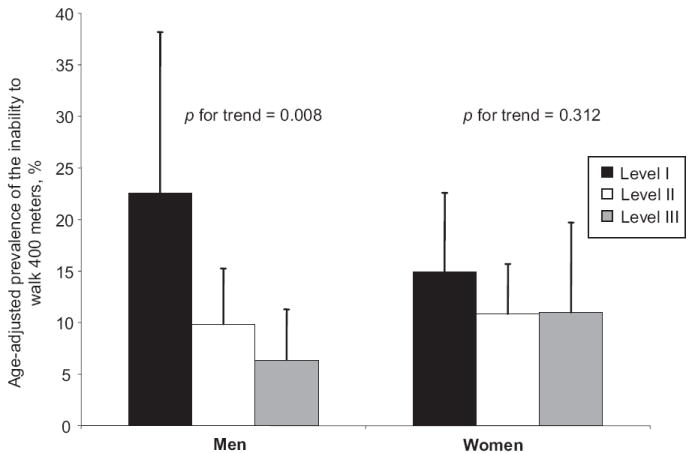
Age-adjusted prevalence of the inability to walk 400 meters and 95% confidence-interval bars by lifetime physical activity index to age 60.
Table 2.
Association of self-reported physical activity at different age periods with mobility outcomes in old agea
| Short Physical Performance Battery |
Unable to walk 400 meters |
|||
|---|---|---|---|---|
| Physical activity | Men b weight (SE) | Women b weight (SE) | Men Odds ratio (95% CI) | Women Odds ratio (95% CI) |
| 20–40 years of age | ||||
| Level I | Reference | Reference | Reference | Reference |
| Level II | 0.26 (0.49) | 0.58 (0.29)* | 0.54 (0.16–1.79) | 0.68 (0.33–1.40) |
| Level III | 0.34 (0.50) | 0.79 (0.35)* | 0.40 (0.12–1.40) | 0.66 (0.29–1.54) |
| p for trend | p = 0.537 | p = 0.026 | p = 0.170 | p = 0.368 |
| 40–60 years of age | ||||
| Level I | Reference | Reference | Reference | Reference |
| Level II | 0.63 (0.39) | 0.43 (0.25) | 0.43 (0.17–1.05) | 0.79 (0.43–1.47) |
| Level III | 0.92 (0.41)* | 0.72 (0.35)* | 0.16 (0.05–0.46)** | 0.86 (0.39–1.90) |
| p for trend | p = 0.023 | p = 0.024 | p < 0.001 | p = 0.620 |
| Lifetime index to age 60 | ||||
| Level I | Reference | Reference | Reference | Reference |
| Level II | 0.67 (0.39) | 0.57 (0.25)* | 0.37 (0.15–0.93)* | 0.69 (0.37–1.28) |
| Level III | 0.85 (0.41)* | 0.84 (0.35)* | 0.23 (0.09–0.63)** | 0.70 (0.31–1.59) |
| p for trend | p = 0.059 | p = 0.008 | p = 0.008 | p = 0.312 |
| Sample size | 440 | 561 | 418 | 525 |
Note: All estimates were adjusted for age.
p < 0.05;
p < 0.01 (all bolded).
CI, confidence interval; SE, standard error.
Adjusting for age, education, cigarette smoking, and BMI did not change the patterns of association between midlife physical activity and mobility outcomes (Table 3, Model 1). The addition of the total number of medical conditions in Model 2 did not substantially change the magnitude or significance of the effect of midlife physical activity from patterns observed in Model 1. In contrast, further adjustment for physiologic impairments in Model 3 reduced the effect size for both mobility outcomes in men, but not in women. Nonetheless, the trend for physical activity in midlife remained significant for both outcomes among men and for the SPPB among women in the fully adjusted models shown in Table 3.
The association of midlife physical activity with mobility in old age was also assessed among those who reported Level-I physical activity in the past year. Adjusting for age, education, smoking history, BMI, and total number of medical conditions, higher levels of physical activity in midlife were significantly associated with better SPPB scores in women (Level II: b=0.29, standard error [SE]=0.27] and Level III: b=1.04, SE=0.41 compared to Level I; p for linear trend=0.016, n =395), but not in men (Level II: b=−0.18, SE=0.55, and Level III: b=0.42, SE=0.55 compared to Level I; p for linear trend=0.390, n = 195). Also in this subgroup of men and women with Level-I physical activity in the past year, the probability of failing the 400-meter walk was lower among those who had higher levels of physical activity in midlife, although these patterns were not statistically significant in men or women.
Discussion and Conclusions
The current study finds that physical activity performed in midlife is associated with mobility in older adulthood. Older Italian adults who reported moderate to vigorous physical activity in midlife (Levels II and III) enjoyed better mobility in old age than those who reported less physical activity (Level I). Specifically, subjects reporting Level-III physical activity in midlife scored nearly a full point higher on the SPPB in old age than those who reported Level-I physical activity (Table 2). A 1-point decline on the SPPB has been shown to significantly increase the risk of death among older adults by 80%.25 Also, men with Level-III physical activity in midlife were markedly less likely to fail the 400-meter walk compared to those with Level-I physical activity (odds ratio=0.23) (Table 2). The effects of midlife physical activity were robust to adjustments for multiple morbidities and physiologic impairments that contribute to declining mobility in older adults. These findings suggest that current U.S. DHHS recommendations for regular physical activity prevent not only chronic diseases, but also might help preserve mobility in old age.
Midlife physical activity was not uniformly associated with both mobility outcomes in men and women. Specifically, higher levels of physical activity were associated with better lower-extremity function (SPPB) in both genders, but the ability to walk 400 meters was associated only with past physical activity in men and not in women. It is possible that there was greater misclassification of physical activity among women because participants may have not considered household work or family care as types of physical activity; therefore, women might have reported lower-than-actual physical activity levels in midlife (e.g., reporting “light” instead of “moderate”).26 Alternatively, the 400-meter walk test is more of a measure of endurance or fitness than the SPPB.16,27 Among participants classified with Level-III physical activity, men may have engaged in more vigorous physical activities in midlife than women. Indeed, while the high prevalence of Level-II physical activity in the InCHIANTI sample likely reflects environmental demand associated with living in a rural region of Tuscany during the mid-twentieth century, the occupational demands of farming at that time and place might have contributed to greater walking endurance among men. Therefore, based on the findings of this population-based study of older Italian adults, moderate physical activity (Level II) in midlife appears to contribute to better lower-extremity function in older adulthood, but more vigorous physical activity (Level III) might be required in order to benefit walking endurance. In view of incoming cohorts of older adults exposed to less physically demanding occupations and more sedentary lifestyle in midlife, prevalence of mobility problems among older adults might grow over time in developed countries; however, the benefits of improved nutrition and medical care over the life course might offset the effects of the increasing prevalence of sedentary behavior on mobility in older adulthood.
The pathways through which midlife physical activity relates to mobility in old age remain unclear. The effect of midlife physical activity remained significant when the total number of medical conditions and physiological impairments were specified in Models 2 and 3 of Table 3, which suggests no substantial mediating effects by these factors. In fact, with the exception of significantly better hip flexor and ankle dorsiflex range of motion among men with higher levels of midlife physical activity, there were no significant age-adjusted associations between midlife physical activity and these potential mediators (results not shown). The lack of association might be explained, in part, by the greater amount of missing data among those who reported lower compared to higher levels of physical activity in midlife, which could effectively reduce the variation of these potential mediators across levels of past physical activity. On the other hand, physical activity might have only modest direct effects on physiologic impairments associated with mobility problems. It might be that physical activity helps to reduce disease severity and improve other factors such as psychological well being that contribute overall to better physical function among older adults.28
The associations observed in the current study are consistent with the few others that have examined physical activity earlier in the life course with self-reported outcomes that assessed overall physical function (defined as the ability to complete a physical action or task).29-32 Most recently, participants in the Whitehall II cohort (median age of 50) who were physically active were more likely than sedentary cohort members to report no difficulty with physical function items in the Short Form-36 questionnaire 9 years later.32 Although these studies support the hypothesis that regular physical activity in midlife is associated with better physical function, they were conducted predominantly in younger adults (aged less than 65 years), relied on self-reported assessments of physical function that are more limited in range (i.e., ceiling effects), and combined the last two stages of the disablement process (functional limitations and disability). In contrast, the current study extends previous observations by (1) specifically examining mobility in older ages (mean age was 75 years) (Table 1) with physical activity levels 30 to 40 years earlier, (2) using objective assessments of mobility function, and (3) testing the robustness of these associations by adjusting for morbidity and physiologic impairments.
The major limitation of the current study is the relatively simple assessment of physical activity. Subjects were asked to categorize themselves into fairly broad levels of physical activity over two age periods that span 20 years each (ages 20 to 40 and 40 to 60), which increases the likelihood of misclassification. The 20-to-40 age period might be particularly prone to misclassification because of the major life cycle events that typically take place (e.g., marriage, having children, entry into the workforce), which could make self-reported physical activity less valid during this age period. Indeed, the effect of physical activity on mobility outcomes was less consistent and relatively weak in the 20-to-40 period than the 40-to-60 period (Table 2). Alternatively, this pattern might not result from misclassification (given that the effects were in the expected direction), but rather were (1) a selection effect whereby those with lower levels of physical activity at ages 20 to 40 years were less likely to survive to older ages, (2) a diminished biological impact of physical activity on mobility function nearly 40 years later, and/or (3) the 40- to 60-year age range might represent a critical period in which physical activity might help offset the impact of developing chronic diseases on subsequent mobility function. Any of these potentialities, either alone or in combination, might account for different patterns of association between the two age periods.
In addition to the potential for misclassification, the retrospective recall of physical activity itself limits causal inference that can be drawn from the observed associations. It is certainly possible that current mobility could influence subjects’ recall of past physical activity. However, this potential bias is reduced by testing associations with two objective assessments of mobility. Further, current physical activity levels were lower than past activity levels (Table 1) and, in additional analyses (not shown), the association of current physical activity with each of the functional mobility tests were substantially stronger than those reported in Table 2. Also, adjustments for physiologic impairments as well as medical conditions that were ascertained through self-report and physician examination help rule out that current health status confounds the association between past physical activity and current mobility. Given that a number of studies in older adults have prospectively demonstrated a positive association between physical activity and physical function,3 the causal direction from midlife physical activity to mobility in older adulthood seems plausible.
Acknowledgments
This research was supported by the Intramural Research Program of the National Institutes of Health, National Institute on Aging.
Footnotes
No financial conflict of interest was reported by the authors of this paper.
References
- 1.Guralnik JM, Ferrucci L, Pieper CF, et al. Lower extremity function and subsequent disability: consistency across studies, predictive models, and value of gait speed alone compared with the short physical performance battery. J Gerontol A Biol Sci Med Sci. 2000;55:M221–31. doi: 10.1093/gerona/55.4.m221. [DOI] [PubMed] [Google Scholar]
- 2.Guralnik JM, Ferrucci L, Simonsick EM, Salive ME, Wallace RB. Lower-extremity function in persons over the age of 70 years as a predictor of subsequent disability. N Engl J Med. 1995;332:556–61. doi: 10.1056/NEJM199503023320902. [DOI] [PMC free article] [PubMed] [Google Scholar]
- 3.Keysor JJ. Does late-life physical activity or exercise prevent or minimize disablement? A critical review of the scientific evidence. Am J Prev Med. 2003;25(suppl 2):129–36. doi: 10.1016/s0749-3797(03)00176-4. [DOI] [PubMed] [Google Scholar]
- 4.Leveille SG, Guralnik JM, Ferrucci L, Langlois JA. Aging successfully until death in old age: opportunities for increasing active life expectancy. Am J Epidemiol. 1999;149:654–64. doi: 10.1093/oxfordjournals.aje.a009866. [DOI] [PubMed] [Google Scholar]
- 5.Ferrucci L, Izmirlian G, Leveille S, et al. Smoking, physical activity, and active life expectancy. Am J Epidemiol. 1999;149:645–53. doi: 10.1093/oxfordjournals.aje.a009865. [DOI] [PubMed] [Google Scholar]
- 6.Simonsick EM, Guralnik JM, Volpato S, Balfour J, Fried LP. Just get out the door! Importance of walking outside the home for maintaining mobility: findings from the women’s health and aging study. J Am Geriatr Soc. 2005;53:198–203. doi: 10.1111/j.1532-5415.2005.53103.x. [DOI] [PubMed] [Google Scholar]
- 7.Gregg EW, Cauley JA, Stone K, et al. Relationship of changes in physical activity and mortality among older women. JAMA. 2003;289:2379–86. doi: 10.1001/jama.289.18.2379. [DOI] [PubMed] [Google Scholar]
- 8.Wannamethee SG, Shaper AG, Walker M. Changes in physical activity, mortality, and incidence of coronary heart disease in older men. Lancet. 1998;351:1603–8. doi: 10.1016/S0140-6736(97)12355-8. [DOI] [PubMed] [Google Scholar]
- 9.Berlin JA, Colditz GA. A meta-analysis of physical activity in the prevention of coronary heart disease. Am J Epidemiol. 1990;132:612–28. doi: 10.1093/oxfordjournals.aje.a115704. [DOI] [PubMed] [Google Scholar]
- 10.Burchfiel CM, Sharp DS, Curb JD, et al. Physical activity and incidence of diabetes: the Honolulu Heart Program. Am J Epidemiol. 1995;141:360–8. doi: 10.1093/aje/141.4.360. [DOI] [PubMed] [Google Scholar]
- 11.Giovannucci E, Ascherio A, Rimm EB, et al. Physical activity, obesity, and risk for colon cancer and adenoma in men. Ann Intern Med. 1995;122:327–34. doi: 10.7326/0003-4819-122-5-199503010-00002. [DOI] [PubMed] [Google Scholar]
- 12.Ferrucci L, Bandinelli S, Benvenuti E, et al. Subsystems contributing to the decline in ability to walk: bridging the gap between epidemiology and geriatric practice in the InCHIANTI study. J Am Geriatr Soc. 2000;48:1618–25. doi: 10.1111/j.1532-5415.2000.tb03873.x. [DOI] [PubMed] [Google Scholar]
- 13.U.S. Department of Health and Human Services. Physical activity for everyone: physical activity terms. Available at: http://www.cdc.gov/nccdphp/dnpa/physical/terms/index.htm.
- 14.U.S. Department of Health and Human Services. Physical activity for everyone: recommendations. Available at: http://www.cdc.gov/nccdphp/dnpa/physical/recommendations/index.htm.
- 15.Ostir GV, Volpato S, Fried LP, Chaves P, Guralnik JM. Reliability and sensitivity to change assessed for a summary measure of lower body function: results from the Women’s Health and Aging Study. J Clin Epidemiol. 2002;55:916–21. doi: 10.1016/s0895-4356(02)00436-5. [DOI] [PubMed] [Google Scholar]
- 16.Simonsick EM, Newman AB, Nevitt MC, et al. Measuring higher level physical function in well-functioning older adults: expanding familiar approaches in the Health ABC study. J Gerontol A Biol Sci Med Sci. 2001;56:M644–9. doi: 10.1093/gerona/56.10.m644. [DOI] [PubMed] [Google Scholar]
- 17.Newman AB, Simonsick EM, Naydeck BL, et al. Association of long-distance corridor walk performance with mortality, cardiovascular disease, mobility limitation, and disability. JAMA. 2006;295:2018–26. doi: 10.1001/jama.295.17.2018. [DOI] [PubMed] [Google Scholar]
- 18.Rolland YM, Cesari M, Miller ME, Penninx BW, Atkinson HH, Pahor M. Reliability of the 400-m usual-pace walk test as an assessment of mobility limitation in older adults. J Am Geriatr Soc. 2004;52:972–6. doi: 10.1111/j.1532-5415.2004.52267.x. [DOI] [PubMed] [Google Scholar]
- 19.Guralnik JM, Fried LP, Simonsick EM, et al. The women’s health and aging study: health and social characteristics of older women with disability. Bethesda MD: National Institute on Aging; 1995. [Google Scholar]
- 20.Folstein MF, Folstein SE, McHugh PR. “Mini-mental state.” A practical method for grading the cognitive state of patients for the clinician. J Psychiatr Res. 1975;12:189–98. doi: 10.1016/0022-3956(75)90026-6. [DOI] [PubMed] [Google Scholar]
- 21.Buschbacher RM. Peroneal nerve motor conduction to the extensor digitorum brevis. Am J Phys Med Rehabil. 1999;78(suppl 6):S26–31. doi: 10.1097/00002060-199911001-00006. [DOI] [PubMed] [Google Scholar]
- 22.Bassey EJ, Short AH. A new method for measuring power output in a single leg extension: feasibility, reliability and validity. Eur J Appl Physiol Occup Physiol. 1990;60:385–90. doi: 10.1007/BF00713504. [DOI] [PubMed] [Google Scholar]
- 23.Gajdosik RL, Bohannon RW. Clinical measurement of range of motion. Review of goniometry emphasizing reliability and validity. Phys Ther. 1987;67:1867–72. doi: 10.1093/ptj/67.12.1867. [DOI] [PubMed] [Google Scholar]
- 24.Leffondre K, Abrahamowicz M, Siemiatycki J, Rachet B. Modeling smoking history: a comparison of different approaches. Am J Epidemiol. 2002;156:813–23. doi: 10.1093/aje/kwf122. [DOI] [PubMed] [Google Scholar]
- 25.Perera S, Studenski S, Chandler JM, Guralnik JM. Magnitude and patterns of decline in health and function in 1 year affect subsequent 5-year survival. J Gerontol A Biol Sci Med Sci. 2005;60:894–900. doi: 10.1093/gerona/60.7.894. [DOI] [PubMed] [Google Scholar]
- 26.Ainsworth BE. Challenges in measuring physical activity in women. Exerc Sport Sci Rev. 2000;28:93–6. [PubMed] [Google Scholar]
- 27.Simonsick EM, Montgomery PS, Newman AB, Bauer DC, Harris T. Measuring fitness in healthy older adults: the Health ABC Long Distance Corridor Walk. J Am Geriatr Soc. 2001;49:1544–8. doi: 10.1046/j.1532-5415.2001.4911247.x. [DOI] [PubMed] [Google Scholar]
- 28.Buchner DM. Physical activity to prevent or reverse disability in sedentary older adults. Am J Prev Med. 2003;25(suppl 2):214–5. doi: 10.1016/s0749-3797(03)00188-0. [DOI] [PubMed] [Google Scholar]
- 29.Ebrahim S, Wannamethee SG, Whincup P, Walker M, Shaper AG. Locomotor disability in a cohort of British men: the impact of lifestyle and disease. Int J Epidemiol. 2000;29:478–86. [PubMed] [Google Scholar]
- 30.Huang Y, Macera CA, Blair SN, et al. Physical fitness, physical activity, and functional limitation in adults aged 40 and older. Med Sci Sports Exerc. 1998;30:1430–5. doi: 10.1097/00005768-199809000-00013. [DOI] [PubMed] [Google Scholar]
- 31.Leino-Arjas P, Solovieva S, Riihimäki H, Kirjonen J, Telama R. Leisure time physical activity and strenuousness of work as predictors of physical functioning: a 28-year follow up of a cohort of industrial employees. Occup Environ Med. 2004;61:1032–8. doi: 10.1136/oem.2003.012054. [DOI] [PMC free article] [PubMed] [Google Scholar]
- 32.Hillsdon MM, Brunner EJ, Guralnik JM, Marmot MG. Prospective study of physical activity and physical function in early old age. Am J Prev Med. 2005;28:245–50. doi: 10.1016/j.amepre.2004.12.008. [DOI] [PubMed] [Google Scholar]