

Abstract
Interneurones are important regulators of neuronal networks. The conventional approach to interneurones is to focus on the mean values of various parameters. Here we tested the hypothesis that changes in the variance of interneuronal properties (e.g. in the degree of scattering of parameter values of individual cells around the population mean) may modify the behaviour of networks. Biophysically based multicompartmental models of principal cells and interneurones showed that changes in the variance in the electrophysiological and anatomical properties of interneurones significantly alter the input-output functions, rhythmicity and synchrony of principal cells, even if the mean values were unchanged. In most cases, increased heterogeneity in interneurones resulted in stronger inhibition of principal cell firing; however, there were parameter ranges where increased interneuronal variance decreased the inhibition of principal cells. Electrophysiological recordings showed that the variance in the resting membrane potential of CA1 stratum oriens interneurones persistently increased following experimental complex febrile seizures in developing rats, without a change in the mean resting membrane potential, indicating that lasting alterations in interneuronal heterogeneity can take place in real neuronal systems. These computational and experimental data demonstrate that modifications in interneuronal population variance influence the behaviour of neuronal networks, and suggest a physiological role for interneuronal diversity. Furthermore, the results indicate that interneuronal heterogeneity can change in neurological diseases, and raise the possibility that neuromodulators may act by regulating the variance of key parameters in interneuronal populations.
The inhibitory innervation of the axo-dendritic axis of cortical and hippocampal principal cells is supplied by stereotyped interneuronal classes, each type specified to receive a certain set of excitatory inputs (input specificity) and target a distinct part of the principal cells' postsynaptic domains (output specificity) (Halasy & Somogyi, 1993). For example, axo-axonic cells synapse on initial segments, basket cells principally contact somata, and the proximal/distal parts of the principal cells' dendritic tree are innervated by additional, specialized interneuronal classes. Within the last two decades, considerable advances have been made towards understanding the physiological properties and functions of these anatomically distinct interneuronal groups (for a review, see Freund & Buzsáki, 1996).
However, it has also been recognized that interneuronal populations possess high levels of diversity (Parra et al. 1998). A major source of heterogeneity comes from physiological properties. Intracellular recordings from morphologically identified axo-axonic cells revealed considerable variance in the degree of spike frequency adaptation, from almost no adaptation to strong adaptation (Buhl et al. 1994 b). Similar observations were made in the case of several other interneuronal types for the degree of adaptation, as well as for input resistance and resting membrane potential (Buhl et al. 1994 b; Scharfman, 1995; Mott et al. 1997; Parra et al. 1998). The degree of variance in electrophysiological properties resulted in an apparent consensus that it is not possible to recognize the different GABAergic interneuronal classes unambiguously purely on physiological grounds (Buhl et al. 1995; for a review containing a discussion of this point, see Buckmaster & Soltesz, 1996).
In addition to variability in physiological properties, the anatomical segregation of interneuronal processes is also not absolute. Postsynaptic targets of basket cells include proximal dendrites (around 45 %), and even initial segments (approx. 3 %) (Buhl et al. 1994 a, 1995). ‘Atypical’ basket cells have also been described, which innervate somata only in about 20 % of their total synaptic targets (Gulyás et al. 1993). In addition, bistratified cells are specialized to innervate pyramidal cell dendrites in the strata oriens and radiatum, but they contact somata as well (approx. 4 %) (Buhl et al. 1994 a; Halasy et al. 1996). Even in the case of the axo-axonic cell, which is considered to be the most stereotyped interneurone, about 10 % of the postsynaptic targets can include somata and proximal dendrites (Buhl et al. 1994 a). Variability also exists in the number of terminals given by a single interneurone onto a single principal cell (range for axo-axonic cells: 2–15 terminals per initial segment; Li et al. 1992; Han et al. 1993; for basket cells: 2–10 synapses; Gulyás et al. 1993; Buhl et al. 1994 a; Miles et al. 1996).
This study tested the hypothesis that changes in the variability in interneuronal populations may have consequences in how interneuronal-principal cell networks interact. The simulation results indicate that heterogeneity in both the physiological and anatomical properties can influence the inhibitory control of principal cells. In addition, experimental evidence is presented to demonstrate that alterations in the variance (and not only in the mean) of interneuronal parameters can take place in hyperexcitable tissues.
METHODS
Multicompartmental modelling techniques were used to study principal cell-interneurone networks. Simulations were run on a 667 MHz PC with Linux and on a 268 MHz PC with Windows operating systems, using the NEURON simulation software (version 4.2.3 for Linux and 4.2 for MS/Windows) (Hines & Carnevale, 1997). The simulator uses a variant of the Crank-Nicholson integration method (Hines & Carnevale, 1995), which shows second-order accuracy and robust numerical stability. The integration time step was dt = 0.01 ms to ensure convergence.
Models of principal cells
Three models of principal cells (PCs) were studied. In most simulations, unless specifically noted, a two-channel model was used. In some simulations, the PC model included the h-channel as well, or the complex bursting CA3 pyramidal cell model of Traub et al. (1991), containing six channel types, was implemented.
Both passive and active properties of the PCs (Spruston & Johnston, 1992; Staley et al. 1992) were adopted from models in Aradi & Holmes (1999 a,b). The input resistance of PCs was 250 MΩ, their membrane time constant was 40 ms, and the resting membrane potential (Erest) was −60 mV. In most of the simulations, the model PCs had 20 compartments, with five functionally distinguished regions (axon, soma, proximal, middle and distal dendrites) with different active channel densities. Principal cell models were also created with 500 compartments (100 compartments for each input domain, i.e. proximal, middle and distal dendrites, soma and axon) to study the effect of variability in the inhibitory synaptic locations.
The two-channel model included Na+ and delayed rectifier K+ channels with kinetics taken from Aradi & Holmes (1999b):
The Na+ current kinetics were as follows:
where g is conductance, I is current and m and h are activation and inactivation variables. The Na+ current activation system kinetics were:
where α and β are kinetic variables. The Na+ current inactivation system kinetics were:
Non-inactivating K+ channel kinetics were taken from Aradi & Holmes (1999 a, b) (modified from Yuen & Durand, 1991):
The K+ current activation system kinetics were:
Unless noted otherwise, the PC dendrites were active in most simulations, with the density of Na+ and delayed rectifier K+ channels gradually decreasing from the proximal towards the distal dendritic ends (gNa,max = 210, 150, 130, 80, 0 mS cm−2 and gK,max = 28, 16, 14, 4, 1 mS cm−2 in the axon, soma, proximal, middle and distal dendrites, respectively).
In the three-channel model, an h-channel conductance was also included. The channel kinetics for h-channel were taken from Chen et al. (2001). The experimentally determined channel kinetics of the Ih in hippocampal CA1 pyramidal cells (Chen et al. 2001) were fitted and used in these simulations:
where Eh = −40 mV. The activation curve for Ih was in the form of:
where V50 was −91 mV. The equations for the fast and slow components of Ih kinetics were:
Ih channels were located in the soma and dendrites with channel density gh,max = 80 mS cm−2.
In the most complex PC model, a model of bursting CA3 pyramidal cells was reconstructed with 19 compartments and six voltage-activated channels (Traub et al. 1991). The model included Na+, Ca2+, delayed rectifier K+, Ca2+-dependent after-hyperpolarizing K+, Ca2+- and voltage-dependent K+, and A-type K+ channels (Traub et al. 1991).
Models of interneurones
For interneurones, the input resistance was 100 MΩ, and the membrane time constant was 15 ms. Sodium, delayed rectifier K+, N-type Ca2+ (N-Ca), and SK+-type calcium-activated K+ channels were included in the interneurone models, with different densities in functionally distinct regions of the interneurones (N-type Ca2+ and SK+ channels were located only in the soma, and the densities of Na+ and delayed rectifier K+ channels were higher in the soma and axon than in the dendrites.) The kinetics for Na+ and K+ channels in the interneurones were the same as in the PCs. The equations for the N-Ca2+ and SK+ channel kinetics were as follows.
The kinetics for INCa were taken from Jaffe et al. (1994) (see also Aradi & Holmes, 1999 a, b):
The kinetics for the N-Ca2+ activation system were:
The kinetics for the N-Ca2+ inactivation system were:
The reversal potential for the calcium current was calculated at each time step with the Nernst equation. Intracellular calcium concentration was also computed in a narrow shell below the cell membrane, depending on the calcium current and calcium removal, as described in Aradi & Holmes (1999 b). For SK+ current, the form of the equations was taken from McCormick et al. (1993):
Those for the SK+ activation system were:
In the interneurones, the N-type Ca2+ and the SK+ channel densities were altered to reproduce different firing patterns and adaptive properties (see below).
Modelling synaptic currents: EPSCs and IPSCs
In the model, interneuronal AMPA-mediated EPSCs were described with fast kinetics (τrise = 0.3 ms; τdecay = 5 ms), to reproduce EPSPs measured in hippocampal basket cells (Kneisler & Dingledine, 1995 a,b; Geiger et al. 1997). The PCs had slower EPSC kinetics (τrise = 0.5 ms; τdecay = 5 ms) (Miles & Wong, 1986; Markram et al. 1997). The EPSC reversal potential (Erev) was 0 mV in both cases. Except when noted otherwise, the excitatory synapses were located in the outer two-thirds of the PC dendrites, and in the middle of the interneuronal dendrites. The IPSCs were modelled with τrise = 1 ms and τdecay = 10 ms, and with Erev = −65 mV (Miles & Wong, 1986; Geiger et al. 1997; Hájos & Mody, 1997; Markram et al. 1997).
For modelling synaptic currents, the following equations were used:
where the time course of the synaptic conductance was:
The gsyn,max was varied in the simulations (as detailed in the corresponding figure legends), and its values were in the ranges that produced physiological Isyn amplitudes. The onset of the synaptic currents was triggered by the presynaptic neurone reaching −25 mV (in order to ensure that interneuronal spikes that may not be overshooting could also initiate synaptic currents).
Modelling neural circuits of PCs and interneurones
The number and location of excitatory and inhibitory synapses, and the number of interneurones and PCs, were varied. In general, increasingly complex network behaviours were simulated using increasingly complex models. For each distinct case, a schematic diagram of the network structure is presented in the corresponding figures. The parameter space that was explored for each set of simulations, together with the number of simulations, are described in the respective figure legends. The ‘percentage of PC spiking suppressed’ (e.g. as in Fig. 5A) was calculated for each input frequency as PC spiking without inhibition minus PC spiking with inhibition, divided by PC spiking without inhibition. In some cases, the ‘average percentage of PC activity suppressed’ (e.g. as in Fig. 5B) was then calculated for the entire range of input frequencies. For most computations (except in Fig. 11), the duration of the individual simulation runs was 1 s.
Figure 5. Variance in the frequency of excitatory inputs.

A, plots of the suppression of PC spiking versus incoming EPSP frequency are shown at three levels of dispersion (d) in the frequency of the excitatory inputs to otherwise homogeneous non-adapting interneurones (see Results for details of how the dispersion was computed; note that there was no change in the mean frequency as the dispersion was increased; the input to the PCs was also dispersed). B, plot of the average suppression of PC spiking, as a function of increasing dispersion in the EPSP input frequency. Synaptic conductances used in this figure: g1 = 11 nS; g2 = 0.4 nS; g3 = 2.1 nS. The number of network simulations (1 s in duration) for this figure was 220. Furthermore, additional network simulations were carried out to explore the effects of frequency variance in the excitatory inputs to interneurones, (i) with different g1, g2 and g3 values; (ii) with (as in the figure) or without dispersion in the frequency of the excitatory inputs to the PCs; and (iii) with the random re-assignment of each individual interneurone to a particular EPSP frequency at each subsequent EPSP (as in the figure), or with the random assignment taking place only once at time zero (in the latter case, therefore, each interneurone received EPSPs at one fixed frequency throughout the simulation run; in either case, however, the mean frequency remained unchanged across the entire interneuronal population). The basic results illustrated in this figure did not change as a function of these parameter changes. The number of these additional network simulations exploring the parameter space was 1068.
Figure 11. Interneuronal heterogeneity and PC synchrony.

Aa, schematic drawing of the circuit; Ba, Ca and Da, superimposed traces of interneurones. The interneuronal populations (HOM-NA, HET and ‘HET increased variance’) were the same as described in Fig. 9. Ab, superimposed traces from five PCs, without inputs from the interneurones (‘No inhibition’); throughout these simulations, each PC received a different amount of constant depolarizing input (in order to desynchronize the PCs). Bb, Cb and Db, superimposed traces from the PCs connected to either the homogeneous (Bb), the heterogeneous (Cb) or the ‘HET increased variance’ interneuronal population (Db). Ac (‘No inhibition’), Bc, Cc and Dc, similar to the middle row, but with the CA3 model cells of Traub et al. (1991) used as the PCs (the interneuronal populations were the same as in the rest of the figures). In this figure, the networks of Fig. 9 were used, with the following differences: the PC-PC and PC-IN connections were not included, and the Idepol excitation to the PCs was increased to produce PC spiking in the absence of interneuronal inputs. The synaptic conductances of the simulations used in the figure were: g1 = 0.6 nS; g2 = 0.2 nS; g3 = 8 nS; Idepol-PC showed a uniform distribution between 0.3 and 0.5 nA among the five PCs in the middle row; for the CA3 pyramidal cells in the bottom row, Idepol-PC was uniformly distributed between 0.2 and 0.4 nA, i.e. lower Idepol-PC amplitudes, but the same degree of dispersion, were employed; Idepol-IN: 0.15 nA; IN-IN = 7 nS. Additional simulations, with essentially similar results, were done in the following parameter ranges: Idepol-PC: 0.2–0.6 nA; g3 = 1–8 nS. The number of network simulations (1–10 s in duration) carried out in connection with the findings illustrated in this figure was 63.
Experimental models of epilepsy: fluid percussion head trauma (for post-traumatic hyperexcitability) and hyperthermia-induced seizures (for febrile seizures)
All procedures relating to the experimental models of epilepsy described in this study were approved by the University of California, Irvine Institutional Animal Care and Use Committee.
Lateral fluid percussion injury
Traumatic brain injury affects millions of people every year worldwide, and among young adults head injury is the leading cause of death and disability (Lowenstein et al. 1992; Toth et al. 1997; Santhakumar et al. 2000). Head trauma, depending on impact strength, can cause neurological problems including post-traumatic hyperexcitability (Santhakumar et al. 2000). However, the mechanisms underlying post-traumatic alterations in neuronal circuits are not well understood. The lateral fluid percussion model in rodents has been shown to replicate various features of human concussive head traumas (Lowenstein et al. 1992). The lateral fluid percussion technique was carried out as described previously (Toth et al. 1997; Santhakumar et al. 2000). Briefly, at postnatal day 18–22, Wistar rats were anaesthetized with Nembutal (65 mg kg−1i.p.; adequate anaesthesia was repeatedly ascertained by the lack of the ocular reflex and by the absence of withdrawal response to a pinch of the hindlimb), and placed in a stereotaxic frame, and the scalp was sagittally incised. A 2 mm hole was trephined to the skull at −3 mm (i.e. caudal) from bregma, 3.5 mm lateral from the sagittal suture. Two steel screws were placed 1 mm rostral to bregma and 1 mm caudal to lambda. A Luer-Loc syringe hub with a 2.6 mm inside diameter was placed over the exposed dura and bonded to the skull with cyanoacrylate adhesive. Dental acrylic was poured around the injury tube and skull screws, and allowed to harden, and the scalp was sutured. Neo-Predef (Upjohn) was applied to the wound, and the animal was returned to its home cage. A day later, the rats were anaesthetized with halothane in a 2 l chamber. After the animal was anaesthetized (surgical level of anaesthesia was ascertained as described above), it was removed from the anaesthetizing chamber, and immediately connected to the injury device (see below). The establishment of the connection to the device took a maximum of 5 s, followed by a < 5 s period during which the lack of a withdrawal reflex was verified one more time, and then (provided that there was no withdrawal reflex) the pendulum was released. Therefore, the animal was fully anaesthetized at the time of injury (as shown by the lack of a withdrawal reflex), even though the halothane was not actively administered at the time of injury. All animals were immediately ventilated with room air. The animals were injured by a moderate (2.0–2.2 atm) impact. Age-matched, sham-operated control animals were treated the same way, including the connection to the FPI (fluid percussion injury) device, but the pendulum was not released.
The fluid percussion device (Department of Biomedical Engineering, Virginia Commonwealth University, Richmond, VA, USA) was identical to that used by several other laboratories (Dixon et al. 1989; McIntosh et al. 1989; Lowenstein et al. 1992) and by us (Toth et al. 1997; Santhakumar et al. 2000). Briefly, the device consisted of a Plexiglas cylinder reservoir filled with saline. At one end of the cylinder a rubber-covered Plexiglas piston was mounted on O-rings. The opposite end of the cylinder contained a transducer, and a metal tube that terminated in a male Luer-Loc fitting. This fitting was then connected to the female fitting that had been chronically implanted. The pressure wave was produced by a pendulum striking the piston of the device. The resulting pressure pulse was recorded by the transducer and expressed in atmospheres pressure. Essentially, this device was designed to inject a small volume of saline into the closed cranial cavity and produce a brief (20 ms) displacement and deformation of brain tissue. The magnitude of pressure wave was controlled by the height from which the pendulum was released (in these experiments, it was 12–13.5 deg, which produced a 2.0–2.2 atm pressure wave). The delivery of the pressure pulse was associated with brief (less than 120–200 s), transient traumatic unconsciousness (as assessed by the duration of post-impact immobility and the suppression of the withdrawal reflex; in contrast, control animals started to spontaneously move around in the cage, and showed vigorous withdrawal responses, within 30 s following sham injury). As described before, animals after a moderate level of fluid percussion injury do not exhibit any obvious lasting behavioural deficit or seizure activity (Toth et al. 1997; Santhakumar et al. 2000). Five minutes following fluid percussion or sham impact, the animals were deeply re-anaesthetized with halothane for killing and the preparation of brain slices as described below under ‘Slice preparation’. Therefore, the period of post-traumatic survival was 5 min.
Hyperthermia model of experimental prolonged febrile seizures in infant rats
Febrile seizures are the most common developmental seizures. Febrile seizures are known to affect up to 5 % of children worldwide (Baram et al. 1997; Chen et al. 1999; Dube et al. 2000). There is increasing evidence from both human and animal studies that prolonged (longer than 15 min), focal (complex) febrile seizures may be associated with subsequent temporal lobe epilepsy (Chen et al. 1999). However, the relationship between prolonged febrile seizures and modifications in seizure threshold in neuronal circuits is not yet understood. The hyperthermia-induced seizure protocol has been performed as described elsewhere (Baram et al. 1997; Chen et al. 1999, 2001; Dube et al. 2000). Briefly, on postnatal day 10, the core temperature of pups (Sprague-Dawley, from Zivic-Miller, Zelienople, PA) was raised using a regulated stream of moderately heated air, aiming for a core temperature of approximately 41 °C (as during high fever; Baram et al. 1997). Rats were placed in a 3 l glass container, and the moderately heated air stream was directed approximately 50 cm above them. Core (rectal) temperatures were measured at baseline, at 2 min intervals, and at the end of hyperthermic seizures. Hyperthermia (defined as core temperature > 39.5 °C) was maintained for 30 min. Seizure duration in this model has been shown to average 22.8 ± 0.3 min, and threshold temperature to seizure onset averaged 41.1 °C (Chen et al. 2001). Controls were normothermic littermates, treated in exactly the same manner (placed in the 3 l glass container for 30 min, with temperature readings every 2 min), but the heated air was not applied. Following the hyperthermia period, rats were placed on a cool surface, monitored for 15 min, and then returned to home cages to their mothers; their well-being was monitored initially every 30 min and, after the first day, at least twice daily throughout the 1 week survival period. The behavioural seizures in this protocol are stereotyped (arrest of the heat-induced hyperkinesis, body flexion, limbic automatisms, occasionally followed by clonus), and correlate with EEG rhythmic epileptiform discharges from the hippocampus and amygdala (Baram et al. 1997; Dube et al. 2000).
Electrophysiological experiments
Slice preparation
Brain slices were prepared as previously described (Toth et al. 1997; Chen et al. 1999). Briefly, the fluid percussion-injured and the sham-operated, age-matched rats, and the rats that experienced hyperthermia-induced seizures and their control littermates, were deeply anaesthetized with halothane. Anaesthetized rats were decapitated, and the brains were removed and cooled in 4 °C oxygenated (95 % O2-5 % CO2) artificial cerebral spinal fluid (ACSF) composed of (mm): 126 NaCl, 2.5 KCl, 26 NaHCO3, 2 CaCl2, 2 MgCl2, 1.25 NaH2PO4 and 10 glucose. All salts were obtained from Fluka. Horizontal brain slices (350 μm) were prepared with a vibratome tissue sectioner (Lancer Series 1000) from the ventral-to-mid-section of the hippocampus (see Toth et al. (1997) for rationale and details). The brain slices were sagittally bisected into two hemispheric components and the slices (in the case of fluid percussion injury, only the side ipsilateral to the impact site was used for the experiments) were incubated submerged in 32 °C ACSF for 1 h in a holding chamber.
Electrophysiology
Individual slices were transferred to a recording chamber (Toth et al. 1997; Chen et al. 1999) perfused with ACSF. Patch pipettes were pulled from borosilicate (KG-33) glass capillary tubing (1.5 mm outer diameter; Garner Glass) with a Narishige PP-83 two-stage electrode puller. Pipette solutions consisted of (mm): 140 potassium gluconate, 2 MgCl2, and 10 Hepes. Infrared video microscopy-aided visualized techniques were used to record interneurones (Axioscope FS, Zeiss). The interneurones in the CA1 stratum oriens and in the granule cell layer of the dentate gyrus could be easily distinguished from the PCs based on their characteristic location and appearance in the infrared video microscope. Recordings were obtained with an Axopatch 200B amplifier (Axon Instruments) and digitized at 88 kHz (Neurocorder, NeuroData) before being stored in PCM form on videotape. The series resistance was monitored throughout the recordings, and the data were rejected if it significantly increased.
Analysis
Recordings were analysed by a personal computer using Strathclyde Electrophysiology Software (courtesy of Dr J. Dempster) and Synapse software (courtesy of Dr Y. De Koninck). As described in Ross & Soltesz (2001), for measurements of resting membrane potential, the recordings were sampled at 1 kHz for 20 s in each minute (data taken from the 5–10 min period after break-in), and the mean value of the resting membrane potential was calculated. Statistical analyses were performed with SigmaPlot, with a level of significance of P ≤ 0.05.
RESULTS
Effects of variance in the expression of ion channels influencing firing patterns
Figure 1 illustrates the effects of heterogeneity in the expression of voltage-gated Ca2+ and Ca2+-activated K+ channels in interneurones on the input-output functions of principal cells (PCs) (Fig. 1Ba and C) and interneurones (Fig. 1Bb and D). The interneuronal network consisted of five anatomically distinct interneuronal classes, each class projecting to a different segment of the PC's somato-dendritic axis (Fig. 1Aa). Physiologically, the interneurones possessed five distinct levels of expression for Ca2+ and Ca2+-activated K+ channels (the N-type Ca2+ channel conductances (gNCa,max) were 7, 11, 13, 17 and 19 mS cm−2, while the corresponding SK+ channel densities (gSK,max) were 0.03, 0.07, 0.11, 0.17 and 0.22 mS cm−2). The differing levels of expression for these ion channels conferred different action potential adaptation properties (Fig. 1Ab), from non-adapting (NA; for the lowest levels of expression, i.e. gNCa,max = 7 and gSK,max = 0.03), to medium adapting (MA1, MA2, MA3) and to strongly adapting (SA; with the highest levels of expression) interneurones. Since some Ca2+ channels (and, consequently, Ca2+-activated K+ channels) were activated even at around the resting membrane potential, the level of Ca2+ and K+ channel expression influenced, in addition to adaptation properties, the resting membrane potential as well (Erest of NA: −56.14 mV; MA2: −58.79 mV; SA: −61.21 mV; note that in Fig. 1Ab, all three traces started from −60 mV; the NA cell subsequently depolarized slightly, whereas the SA hyperpolarized from −60 mV to reach Erest). The interneurones in the network (Fig. 1Aa) were either all of the same kind (in which case the interneuronal network was called ‘homogeneous’, abbreviated as ‘HOM’), or each anatomical class contained five physiologically different interneurones (this was the case of the ‘heterogeneous’ network, or ‘HET’). The interneurones in the HOM networks were either all non-adapting (HOM-NA), or all strongly adapting (HOM-SA), or they belonged to one of the three intermediate cases (HOM-MA1, HOM-MA2, HOM-MA3). In the HET interneuronal network, each anatomically defined layer (Fig. 1Aa) contained cells from all five physiological classes (i.e. NA, MA1–3, SA) in equal proportions. The excitatory inputs arrived on the dendrites of both the interneurones (g2 in Fig. 1Aa) and the principal cells (g1 in Fig. 1Aa). Unless stated otherwise, the excitatory inputs arrived regularly and synchronously on all cells. The combination of the synaptic conductances g1, g2 and g3 used in these simulations are described in the legend to Fig. 1, and are also indicated in Fig. 2A.
Figure 1. Variance in ion channel expression in interneuronal populations influences principal cells.

Aa, diagrams illustrate the simulated network. Ab, firing patterns of the interneurones (INs): NA, non-adapting; MA2, medium-adapting, type 2 (see text); SA, strongly adapting cells. All cells started at −60 mV. The current pulse (bottom drawing; 0.05 nA for 200 ms) was delivered from the resting membrane potential. The firing threshold was the same for all cell types. Ba, the PC firing rate (based on 1 s long simulations, calculated from the entire 1 s period) is plotted as a function of incoming excitation frequency, for the no-inhibition case (‘No inh’), and when the PC was connected to one of the homogeneous (HOM) interneuronal populations (NA, MA1, MA2, MA3 and SA; see text), or to the heterogeneous (HET) interneuronal population (containing an equal mixture of NA, MA1, MA2, MA3 and SA cells; in the HET case, each layer in Aa contained all five adaptation types). Synaptic conductances were g1 = 5.5 nS, g2 = 0.4 nS, g3 = 1.4 nS (g2g3 /g1 = 0.102 nS in Fig. 2A). The inset shows PC firing rates at the lowest EPSP frequencies. Bb, the firing rates of the interneurones are plotted as a function of the incoming excitation frequency. C, the PC spiking rates in the HET network did not equal the mathematical average of the PC spiking rates in the five HOM networks shown in Ba (‘heterogeneous-estimated’, HET-EST). D, superimposed traces from five interneurones from the HOM and HET networks, in response to 600 Hz EPSPs (arrow in Bb). Note the temporal dispersion of the interneuronal firing in the HET network. Since the inputs arrived synchronously in Figs 1–3, each physiological class could be simulated by a single IN projecting to all five input regions on the PC (for all simulations after Fig. 3 except for Fig. 7, the networks contained 25 individually simulated interneurones; the number of PCs was one in Figs 1–7, and five in Figs 8–11). The number of simulations (1 s) carried out for the results in this figure was 91.
Figure 2. Effects of variance in interneuronal ion channel expression on PC firing as a function of synaptic parameters.

A-C, the effect of variance in ion channel expression levels in interneuronal populations described in Fig. 1 for one set of synaptic conductance values is shown here for a large set of parameter values. Values for g1, g2, g3: in A, g1 was varied between 5 and 25nS, while g2 = 1.2 nS and g3 = 1.5 nS were fixed; in B, g1 = 11 nS, g2 varied between 0.4 and 2 nS, g3 = 1.5 nS; in C, g1 = 11 nS, g2 = 0.4 nS, and g3 varied between 1.5 and 2.7 nS. The value of g2g3 /g1 plotted on the x-axes is a measure of the relative strengths of inhibition (g2g3) and excitation (g1) (see drawing in Fig. 1Aa). The vertical arrows point to combinations of conductance values also used in other figures: in A, for Fig. 1B: g2g3 /g1 = 0.102 nS; in B, for Fig. 4B: g2g3 /g1 = 0.153 nS; in C, for Fig. 4A: g2g3 / g1 = 0.0764 nS. The number of network simulations (1 s in duration) carried out in relation to the results illustrated in this figure was 988.
As shown in Fig. 1Ba, the PC firing rate naturally depended on the interneurone type(s) that made up the interneuronal network. The degree of modulation by the various interneuronal networks can be seen in reference to the case when all interneurones were removed (the no-inhibition case; ‘No inh’ in Fig. 1Ba; the inset in Fig. 1Ba illustrates the PC firing rate at the lowest EPSP frequencies in an expanded scale). Among the homogeneous networks, the HOM-NA interneuronal network caused the most pronounced inhibition at lower EPSP frequencies. The HOM-MA1 network started to inhibit at higher EPSP frequencies, followed by HOM-MA2, HOM-MA3 and, finally, by HOM-SA. The existence of a distinct ‘critical EPSP frequency’ (defined as the lowest EPSP frequency at which the interneurone starts to reach firing threshold) for each homogeneous interneuronal network is illustrated in Fig. 1Bb. The HOM-NA interneurones (possessing the most depolarized resting membrane potential; Fig. 1Ab) started to fire at the lowest levels of excitatory inputs. Interneurones that had higher levels of Ca2+ and Ca2+-activated K+ channels had progressively higher ‘critical frequencies’ (Fig. 1Bb).
The behaviour of the network that consisted of heterogeneous interneurones (‘HET’ in Fig. 1Ba) differed considerably from the homogeneous networks. The firing rate of the PC connected to the HET interneuronal network could not be predicted from the behaviour of the individual HOM networks. In fact, the mathematical average of the principal cell firing rates of the five HOM networks of Fig. 1Ba (heterogeneous-estimated or ‘HET-EST’) was different from the behaviour of the actual HET network (Fig. 1C). Also, although the average of the ion channel conductance values of the cells in the HET network (i.e. average gNCa,max = 13.4 mS cm−2; average gSK,max = 0.12 mS cm−2) was close to the values for the MA2 cells (gNCa,max = 13 mS cm−2; gSK,max = 0.11 mS cm−2), the effect of the HET network on PC spiking was distinct from the effect of the HOM-MA2 network (Fig. 1Ba).
Since NA interneurones could sustain the highest firing rates (Fig. 1Bb), and had the most depolarized resting membrane potential, the PC connected to HOM-NA interneurones received the highest frequency of IPSPs. In all other networks, including HOM networks as well as the HET network, the total number of spikes in the presynaptic interneurones (and, consequently, the number of the IPSPs received by the principal cell) was lower than in the HOM-NA network. However, even though the HOM-NA interneurones had the highest tonic firing rates at any EPSP frequency, there were excitatory input frequencies where the PC in the HET network showed lower firing rates than the PC in the HOM-NA network (Fig. 1Ba). Therefore, simple spike rates in the presynaptic interneuronal population could not predict the degree of inhibition of PC firing rates. In addition to presynaptic spike rates, an important difference between the interneuronal populations was the degree of synchrony in action potential discharges. In HOM networks, the interneurones fired in synchrony (since the interneurones in the HOM networks were identical; for non-identical HOM-NA responses, see Figs 4–6), whereas in the HET network, the interneuronal spikes occurred temporally dispersed (Fig. 1D). At lower EPSP frequencies, the HOM-NA network suppressed principal cell firing to a larger degree than the HET network, since HOM-NA interneurones possessed the lowest ‘critical frequency’, and, at these lower excitatory input frequencies, the HET network had silent interneurones (e.g. the SA interneurones, which had the highest ‘critical frequency’, Fig. 1Bb). However, as the input frequency was increased, and all interneurones in the HET network started to fire (including the SA cells), the degree of inhibition by the HET network started to surpass that of the HOM-NA network (Fig. 1Ba). Therefore, the shape of the principal cell input-output curve for the HET network in Fig. 1Ba was a complex function of the switching on of the various NA, MA and SA cells at distinct critical frequencies (Fig. 1Bb), and of the temporal dispersion of the presynaptic spikes resulting in synchronous or asynchronous IPSPs (see also Fig. 9). Taken together, these simulation results suggest that variance in the levels of ion channel expression (which was the root cause of the physiological differences between the NA, MA and SA cell types) can modulate the behaviour of neuronal networks, and that the effect of the HET interneuronal network on the PC is different from the average effect of the HOM networks, in spite of the fact that the HET network contained all five types of cells (i.e. NA, MA1, MA2, MA3 and SA cells) in equal proportion.
Figure 4. Variance in the phase of the excitatory inputs.

A, C and E, input-output curves are shown for PCs (two-channel model) inhibited by homogeneous or heterogeneous interneuronal networks (HOM-NA, HOM-SA and HET), that differed in their levels of ion channel expression and firing patterns as described in Fig. 1. The EPSPs arrived either synchronously (A) or asynchronously (C). The difference between the suppression of the PC spiking after and before the introduction of phase differences in the incoming excitation is shown in E (i.e. E = C – A). The insets in A and C illustrate the firing of 10 interneurones (INs) and the PC, at 100 Hz input frequency (indicated by the vertical arrows in the plots). Synaptic conductance values: g1 = 11 nS, g2 = 0.4 nS, g3 = 2.1 nS. B, D and F, similar simulations are shown as in A, C and E, but with a different set of synaptic conductance values: g1 = 11 nS, g2 = 1.2 nS, g3 = 1.4 nS. The simulations in this and the following two figures included 25 individually modelled interneurones and one PC. The total number of network simulations (1 s in duration) carried out in connection with the results illustrated in this figure was 192.
Figure 6. Effects of variance in the resting membrane potential and leak current in interneuronal populations.
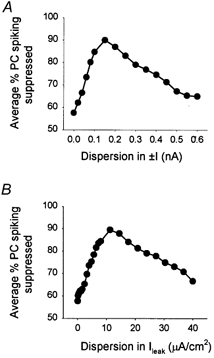
A, average percentage of suppression of PC spiking, as a function of increasing dispersion of the injected depolarizing or hyperpolarizing constant current into interneurones (the sum of the injected current across the interneuronal population was zero, and the injected current showed a uniform distribution). Each of the 25 inhibitory synapses along the PC's axis was driven by an interneurone that had a unique value of depolarizing or hyperpolarizing constant current input. B, the leak conductance value of interneurones was dispersed among the 25 interneurones with a uniform distribution and unchanged mean (8 × 10⁻² mS cm−2). The synaptic conductance values for the simulations shown in this figure were: g1 = 0.011 nS, g2 = 0.0004 nS, g3 = 0.0017 nS. The total number of simulations (1 s in duration) carried out in relation to the findings illustrated in this figure was 770.
Figure 9. Effects of interneuronal heterogeneity in firing patterns on interneuronal synchrony and subthreshold oscillations in PCs.

Aa, Ba and Ca, superimposed traces from 25 interneurones illustrate that increasing heterogeneity in the interneuronal population decreases the synchrony of interneuronal firing. Ab, Bb and Cb, intracellular membrane potential oscillations indicate synchronized IPSPs in the PCs connected to the HOM-NA interneurones (in Ab). As the heterogeneity in the interneuronal population was increased, the IPSPs desynchronised (Bb and Cb). The horizontal line indicates the average membrane potential values. The insets show the corresponding fast Fourier transform (FFT) plots. Ac, Bc and Cc, effects of increased excitatory inputs to the PCs are illustrated. The networks included 25 interneurones and five PCs. Synaptic conductances were: g1 = 0.55 nS, g2 = 0.2 nS, g3 = 8 nS, PC-to-PC: 50 nS, PC-to-IN: 10 nS, IN-to-IN: 7 nS. The IN-IN coupling conductance was set to obtain gamma frequency (approximately 40 Hz) firing in the homogeneous inhibitory network. The slow muscarinic septal inputs to the PCs and INs were modelled by a steady depolarization: Idepol = 0.15 nA (‘Septum ACh’ in the inset). A mixture of 100, 200 and 500 Hz (in 1 : 1 : 1 proportion) EPSPs were arriving at the dendrites of the PCs and interneurones as background excitation. In the bottom row, the step-wise increase in excitation was produced by increasing the relative proportion of the 500 Hz component of the background excitation from 1 : 1 : 1 to 1 : 1 : 6. The HOM-NA network was the same as in previous figures (i.e. gSK = 0.03 mS cm−2; gNCa = 7 mS cm−2). The HET network did not contain the five classes used in previous simulations (i.e. NA, MA1–3, SA); instead, in this and subsequent simulations, each of the 25 interneurones in the HET network had distinct ion channel expression values between gSK = 0.08 and 0.36 mS cm−2 and between gNCa = 7 and 21 mS cm−2, with the population being distributed according to a uniform function around the mean. When the heterogeneity was further increased (as in Ca), the conductance values varied between gSK = 0.0–0.44 mS cm−2 and gNCa = 0.0–28 mS cm−2. Note that the mean conductance values (gSK = 0.22 mS cm−2 and gNCa = 14 mS cm−2) were the same in Ba and Ca. Essentially similar results could be obtained with additional simulations carried out within the following parameter ranges: depolarizing current injection to PC (Idepol-PC): 0.01–0.5 nA; g1 = 0.05–1 nS; g2 = 0.12–1.2 nS; g3 = 1.4–8 nS; PC-PC: 1.4–50 nS; Idepol-IN: 0.1–0.18 nA; PC-IN: 1–20 nS; IN-IN: 3–80 nS. Total number of network simulations carried out in connection with the results illustrated in this figure was 69.
Figure 2 shows that similar conclusions could be reached with a large variety of synaptic conductance values. For each point in Fig. 2, input-output curves (as in Fig. 1Ba) were calculated for the HOM-NA, HOM-SA and the HET cases. The average inhibition of the PC firing rate for each network, compared with the no-inhibition case, was then calculated for the entire range of incoming excitation frequencies. As illustrated in Fig. 2, the effect of the HET network for most g values fell outside the two extremes of HOM networks (HOM-NA with the highest interneuronal firing rates, HOM-SA with the lowest interneuronal firing rates), indicating that the HET network's effect on PC firing was different from the average HOM case. In fact, the only time the HET curves in Fig. 2 fell in between the HOM extreme cases was when the g2 value (i.e. the strength of the excitatory drive to interneurones) was low. In the latter case, the ‘critical frequencies’ of interneuronal activation (Fig. 1Bb) were shifted to the right (since with g2 being low, it took a higher frequency for the weaker EPSPs to discharge the interneurones). Therefore, when g2 was low, the HET network's SA cells switched on only at the highest incoming excitation frequencies, causing a drop in the average suppression of PC spiking by the HET network, resulting in the shifting of the HET curve in Fig. 2B below the HOM-NA curve and between the two HOM curves (note that the curves in Fig. 2C were calculated using the lowest g2 value).
Excitation by interneurones
In all of the simulations discussed so far, the presence of interneurones reduced the firing rate of the PC. However, it has been shown in modelling studies that interneurones can also enhance PC spike rates (Lytton & Sejnowski, 1991). The reason for this apparent discrepancy is that our PC model contained only two voltage-gated conductances (gNa and gK), whereas in the three-channel PC model of Lytton & Sejnowski (1991) a slow K+ channel was also included. In the latter model, the hyperpolarization caused by the IPSPs could turn off this slow K+ conductance, making subsequent firing more likely. Recently, an alternative pathway for the IPSP-induced firing, involving the hyperpolarization-activated h-channels, was shown by experimental and modelling results from our laboratory (Chen et al. 2001). When h-channels were added to our two-channel PC model, the firing rate of the PC in the HOM-NA network could surpass that of the no-inhibition case at lower EPSP frequencies (Fig. 3). (Note that at the low EPSP frequencies shown in the expended x-axis of Fig. 3B, the ‘no-inh’ and the HOM-SA input-output curves were identical, due to the high ‘critical frequency’ for the SA cells.) The excitatory effect of the HOM-NA interneurones could be explained by the activation of Ih by the synchronized IPSPs, leading to rebound excitation following the IPSPs, due to the slow deactivation kinetics of Ih (Chen et al. 2001). This effect can only occur at relatively low input frequencies (as shown in Fig. 3B), since, at high frequencies of excitation of the interneurones, the virtually tonic IPSPs in the PC do not allow for the post-inhibitory rebound to take place (although the IPSPs become tonically limited in their amplitudes by the activated Ih). Traces of the spiking activity of the PC at 10 Hz incoming excitation are shown in Fig. 3C, displaying the firing rate of the PC in the HOM-NA network that is higher than even the ‘no-inhibition’ case. Importantly, even in such cases when the interneurones increased the PC firing frequency, the spiking activity of the PC in the HET network was distinct, and it could be even outside the range defined by the HOM-NA and HOM-SA cases (as in Fig. 3C).
Figure 3. Influence of heterogeneity on the excitation of PCs by interneurones.

A and B, input-output curves are shown for a PC model that includes h-channels (described in Methods; see also Chen et al. 2001). In B, the x-axis was expanded to better illustrate that the PC connected to the NA interneuronal network increased its firing rate compared with the ‘no-inhibition’ case at 10 Hz and 15 Hz input frequencies. C, representative traces of PC spiking are illustrated, in response to 10 Hz EPSPs. Further details of the simulations: Ih was included in the soma and dendrites with gh,max = 80 mS cm−2; g1 = 11 nS, g2 = 1.2 nS, g3 = 2.1 nS. Additional simulations were also carried out with amplitudes of inhibition varying between g3 = 1.4 and 2.1 nS, and the densities of h-current varying between gh,max = 60 and 150 mS cm−2; these parameter sets were examined up to 100 Hz stimulation frequencies. Increased PC firing (compared with the no-inhibition case) was found only close to parameters given here for this figure. The number of network simulations done in connection with the results illustrated in this figure was 172.
Variance in EPSP phase and frequency
In the previous simulations, the EPSPs arrived synchronously on both the PCs and the interneurones, and the effects of variance in the levels of interneuronal channel expression were tested. What is the effect of ‘external’ variance, e.g. variance in the phase of the incoming EPSPs? Figure 4 shows simulations that addressed this question. Each individual interneurone was randomly assigned to receive incoming EPSPs with a delay compared with other interneurones. To achieve maximal asynchrony at each examined EPSP frequency, there was a uniform distribution of the phase lag within one period across the interneuronal population.
As expected from the results discussed in connection with Fig. 1 and Fig. 2, at the lowest EPSP frequencies, the HOM-NA network showed the strongest suppression of PC spiking (Fig. 4A). The insets in Fig. 4A illustrate the spiking behaviour of 10 HOM-NA interneurones, as well as that of the postsynaptic PC, at the EPSP frequency indicated by the arrow. Because the HOM interneurones were identical and the EPSPs arrived synchronously, the interneurones discharged in unison in Fig. 4A. As expected, the EPSP phase dispersion resulted in a temporally asynchronous activation of the interneurones (upper inset in C), which, in turn, increased the suppression of PC spiking (compare lower insets in A and C). The difference of the input-output curves after and before EPSP phase dispersion (C – A) are displayed in Fig. 4E, indicating that phase dispersion had either no effect, or it increased the inhibition of PC spiking (i.e. the difference values were either zero or positive). The right-hand panels in Fig. 4 (B, D and F) illustrate similar results obtained with a different set of parameter values (g2, the excitatory drive to interneurones, was tripled, whereas g3 was decreased by 33 %). Note that with the larger g2, interneurones discharged at higher rates (compare the upper insets in Fig. 4A and B), which resulted in stronger inhibition of PC spiking at most input frequencies (Fig. 4A and B). As shown in the lower inset in Fig. 4B, the increased g2 resulted in only subthreshold membrane potential fluctuations in the PC connected to the HOM-NA network at the input frequency indicated by the arrow. The temporal dispersion of the interneuronal spiking (upper inset in Fig. 4D) decreased the amplitude of the subthreshold activity in the PC (compare lower insets in Fig. 4B and D).
It should be noted that, without the simulations of Fig. 4C and D, we could not have predicted the maximum effects for the EPSP phase dispersion on the suppression of PC spiking (i.e. the position of the peaks in Fig. 4E and F). For example, the ratio of the maximal phase dispersion at each EPSP frequency and the interneuronal (or the PC) interspike interval did not correlate well with the positions of the peaks and troughs in Fig. 4E and F (data not shown), indicating that the position of the maximal phase-dispersion effects is a complex function of the interneuronal and PC firing rates and the frequency-dependent value of the maximal phase difference (expressed in milliseconds) in the incoming EPSPs. However, the peaks tended to shift to lower frequencies (compare Fig. 4E and F) as the increased g2 in Fig. 4F shifted the ‘critical frequency’ of the interneurones towards lower EPSP frequencies.
Next, the effect of variance in the frequency of the EPSP inputs to otherwise homogeneous (NA) interneurones was tested (Fig. 5). For each EPSP frequency, the suppression of PC spiking was computed with various degrees of frequency dispersion (e.g. for 20 % dispersion at 100 Hz, interneurones received EPSPs from 80 Hz to 120 Hz; again, there was a uniform distribution of the dispersion of the inter-event interval across the interneuronal population). The assignment of the EPSP frequency (i.e. which individual interneurone received the EPSP with the inter-event interval corresponding to 80 Hz in the above example) was recomputed for each subsequent EPSP. An important property of the introduced variance in the frequency of the incoming excitatory signals to interneurones was that the mean EPSP frequency did not change (e.g. in the above example, the mean EPSP frequency remained at 100 Hz even as the scatter around the mean was increased). Figure 5A shows how the suppression of PC spiking changed as a function of incoming excitation, at three different levels of dispersion in EPSP frequency. Each curve in Fig. 5A was then used to compute one point in Fig. 5B, which illustrates the average suppression of PC spiking across the entire excitatory input frequency range. Lower levels of EPSP frequency variance enhanced the suppression of PC spiking (Fig. 5A and B), since, as with EPSP phase dispersion, the interneurones discharged asynchronously. Around 30 % frequency dispersion, the suppression of PC spiking started to reach maximum. However, at the highest levels of EPSP frequency dispersion (90 and 100 %), the suppression of PC spiking started to actually decrease (Fig. 5A and B). The explanation for this latter effect is that, at high levels of frequency dispersion (e.g. at d = 100 %), there were interneurones in each cycle that received EPSPs only at extremely low frequencies (e.g. close to 0 Hz). In addition, those interneurones that were assigned to receive EPSPs at the high end of the frequency scatter could not fully functionally compensate for the lack of activation of the interneurones that received only low frequency EPSPs, because, at the highest input frequencies, the interneuronal firing rate was slower than the EPSP frequencies (since many EPSPs came in the refractory period for interneuronal firing). Taken together, these results with the EPSP frequency dispersion indicate that changes in the variance of interneuronal inputs can have a highly non-linear effect on the input-output functions of PCs, even when the mean EPSP frequency does not change. In addition, the data also suggest that changes in the variance in interneuronal functions can both decrease and increase interneuronal suppression of PC spiking (e.g. at some input frequencies in Fig. 5A, the plot for the 100 % dispersion was actually below the zero-dispersion curve).
Variance in interneuronal resting membrane potential and leak conductance
Figure 6A illustrates the effect of variance in the resting membrane potential of homogeneous NA interneurones on the suppression of PC spiking. As in Fig. 5B, each point represents the average suppression of PC spiking computed from individual input-output curves. A given amplitude of constant depolarizing or hyperpolarizing current was injected into each interneurone, with randomly assigned amplitudes that showed a uniform distribution across the interneurones. The mean injected current was zero when computed for the entire interneuronal population (i.e. there was no change in the mean Erest value). As the scatter in the injected constant current was increased, the suppression of PC spiking by the interneurones also increased (Fig. 6A), since the introduction of heterogeneity in the resting membrane potentials resulted in a dispersion of the ‘critical frequency’ for the NA interneurones, which, in turn, led to an asynchronous activation of interneurones. However, when the dispersion in the resting membrane potential values increased above a certain value, the effect of some interneurones being too hyperpolarized for activation by the incoming EPSPs started to manifest itself, resulting in a relative decrease in the suppression of the PC firing by the interneuronal network. These results will be especially relevant in light of experimental data indicating that the variance of resting membrane potentials within an interneuronal population can indeed undergo significant changes in some seizure disorders (see below).
In addition, similar results were obtained when the variance of the leak conductance was altered (by randomly assigning a different gleak value to each individual interneurone). Naturally, alterations in gleak affect both the input resistance and the resting membrane potential of the cells. Again, the dispersion of the gleak values among the individual interneurones was done without changing the mean gleak value in the interneuronal population as a whole. As shown in Fig. 6B, variance in the gleak value of the interneurones initially increased, then decreased the suppression of PC spiking by the interneuronal network, for reasons already discussed above in connection with previous results.
Variance in interneuronal projections to principal cells
In the results described so far, variance, introduced in several different ways, affected primarily the temporal properties of the action potential discharges taking place in the interneuronal population. Here we describe simulations where changes in variance took place in the spatial (anatomical) aspects of interneuronal properties. First, the effect of dispersion of inhibitory synapses was tested in a passive cable (Fig. 7Aa–c). Inhibitory synapses were either all clustered in a single point (‘Clustered’), or evenly distributed along the segment (‘Distributed’), and the interneurones received EPSPs at various frequencies (in Fig. 7Aa–c, the EPSP frequency was 600 Hz; in Fig. 7Aa and b, the cable segment did not receive EPSPs). As shown in Fig. 7Aa and b, the peaks of the IPSPs were close to the reversal potential for ECl (−65 mV), indicating that they were close to saturation point. Because of the limit posed by ECl, the IPSPs were of similar size irrespective of the degree of clustering, examined either at the middle (Fig. 7Aa) or the end (Fig. 7Ab) of the cable. The small difference in the ‘clustered’ and ‘distributed’ IPSPs in Fig. 7Ab (note the expanded y-scale) indicates the small amount of attenuation of the IPSPs originating from the clustered synapses when observed close to the end of the cable (λ ∼ 1 mm, and the cable length from the middle to the end was 100 μm). However, when the EPSPs were also added to the cable (Fig. 7Ac), the IPSPs were ‘pulled away’ from ECl (note that the EPSPs arrived at 600 Hz in Fig. 7Ac, whereas the IPSPs occurred only at around 100 Hz). In addition, because the excitatory depolarizing influence increased the driving force for the IPSPs, the small difference in the local inhibitory conductances at the end of the cable was magnified, resulting in significantly larger IPSPs for the distributed inhibitory inputs (Fig. 7Ac).
Figure 7. Effects of heterogeneity in interneuronal projections to PC dendrites.

Aa-c, effect of spatial dispersion of inhibitory synapses along a passive cable segment. Aa,- b, IPSPs only; Ac, EPSPs and IPSPs. Aa, membrane potential changes in the middle of the cable; Ab-c, end of the cable. The inhibitory synapses were either clustered into the middle of the segment, or uniformly distributed along the cable. For the examples shown in Aa-c, the frequency of the incoming excitation to the interneuronal dendrite (and, in Ac, to the cable as well) was 600 Hz. B, average suppression of PC spiking as a function of increasing dispersion of the inhibitory synapses along the PC's middle dendritic segment. C, average suppression of PC spiking when hyperpolarizing current injections (triggered by interneuronal firing) was used, instead of synaptic conductances. Because the excitatory inputs arrived synchronously, a single, non-adapting (with gNCa,max = 7 mS cm−2, and gSK,max = 0.03 mS cm−2) interneurone was used in these simulations, which gave 150 synapses to a 200 μm long passive cable with 500 compartments (Aa-c), or to the middle segment of the PC dendrite containing 100 compartments (in B and C). This arrangement is equivalent to 150 identical (in this case, non-adapting) interneurones, each giving a single synapse and receiving synchronous excitatory inputs. The number of simulations (1 s duration) carried out for the data included in this figure was 188. In A, the synaptic conductance values were g1 = 11 nS, g2 = 0.4 nS, g3 = 1 nS; 48 additional simulations were also done with g3 = 0.5 nS. In B, the conductance values were g1 = 11 nS, g2 = 0.4 nS, g3 = 1 nS; additional 350 simulations were done with g3 changed between 0.4 and 1 nS, and with both passive and active channels included in the dendrites. In C, the synaptic conductances were g1 = 11 nS, g2 = 0.4 nS, and Ihyperpol = 30 pA; a total of 350 additional simulations were done when Ihyperpol was changed between 2 and 30pA (g1 and g2 was the same, input frequency was systematically varied from 0 to 1000 Hz). An additional 140 simulations explored the effects of anatomical heterogeneity (synaptic dispersion) when the interneurones projected to five different regions of the PC, with 30 synapses to each, and the g3 was varied between 0.2 and 0.45 nS. Similarly, additional 420 simulations were carried out when the current injection (as in C) was targeted to five input regions of the PC, 30 injection points in each region, and the Ihyperpol was varied between 2.25 and 10 pA. The general effect of spatially distributed inhibitory inputs in these additional simulations was similar to that shown in this figure. Taken together, the number of simulations done in relation to the findings illustrated in this figure was 1496.
When the effect of spatial dispersion of inhibitory inputs was tested, at several degrees of dispersion, on the suppression of spiking in a PC model (Fig. 7B), the increasing dispersion resulted in increasing inhibition of PC firing rates, as predicted by the passive model. The role of ECl in these findings was also tested with hyperpolarizing currents, instead of saturating synaptic conductances (in effect, by removing the limitation on the IPSP amplitudes posed by ECl). As shown in Fig. 7C, dispersion of the sites of current injection along the dendrite did not alter the suppression of the PC spiking, indicating the role of saturation of IPSPs in the inhibition-enhancing effects of increasing dispersion of interneuronal synaptic terminals.
Variance in interneuronal firing properties and sudden changes in excitation
Does heterogeneity in Ca2+ and Ca2+-activated K+ channel expression among cells in an interneuronal population influence how interneurones modulate principal cell discharges during sudden changes in incoming excitation? The three left panels in Fig. 8A show the response of a PC to a step-wise increase in incoming EPSP frequency (from 50 Hz to 200 Hz) when the PC is connected to a heterogeneous interneuronal network (as in Fig. 1, the heterogeneous interneuronal population contained NA, MA1, MA2, MA3 and SA cells in equal proportion), or to the two extreme cases of homogeneous interneuronal networks (HOM-NA and HOM-SA). The three right panels in Fig. 8A illustrate the PC responses when the step was increased even more (to 600 Hz). The response of the PC connected to the HET interneuronal population differed from the responses of the PCs connected to the interneurones with zero variance. In fact, the PC firing in the HET network during the EPSP burst was not simply an average of the PC firing rates of the HOM-NA and HOM-SA networks. These results further indicate that the variance in ion channel expression among the interneurones can bring about novel response properties for the input-output functions of the PCs, which cannot be predicted from knowing the responses of the networks connected to homogeneous interneurones representing the two extremes of the interneuronal firing properties. As shown in the right panels in Fig. 8A, even the direction of the response of the PC to the burst of EPSPs could differ between HET and HOM networks, since the HET interneuronal population decreased the PC firing rate, whereas the PC connected to the HOM interneurones increased the rate of action potential discharge during the increased excitation to 600 Hz inputs. Note that the NA interneurones were the most excitable interneurones (non-adapting firing, most depolarized resting membrane potential, lowest ‘critical frequency’), yet they did not suppress PC firing during the increased period of excitation, whereas the HET interneurones did so. As mentioned in connection with Figs 1–4, the temporal dispersion of the interneuronal firing in the HET network, compared with the synchronized firing in the HOM interneurones, was a major factor for the different modulation of PC firing rates. Furthermore, in these simulations illustrated in Fig. 8, the interneurones could also elicit IPSPs in each other through axon collaterals, which meant that the synchronously discharging HOM interneurones could shut each other off, as the input frequency was increased. In the HET network, mutual inhibition of interneurones also took place, e.g. the highly excitable NA cells caused inhibition of the SA cells. Figure 8B illustrates similar findings in a network with an even more complex connectivity (here, PC-to-PC connections were also included, setting up the possibility for recurrent, mutual excitation between PCs). Under these conditions, the distinct modulation of PC firing rates lasted even beyond the burst of EPSPs (asterisk). Note that the excitatory inputs were switched off completely following the period of increased excitation (Fig. 8B, bottom panel). The PCs in the HET network fell silent during the post-stimulation period. In contrast, the PCs in the HOM network continued to fire in a sustained manner following the perturbation, even in the absence of incoming excitation (note that, before the step-wise change in EPSPs, none of the PCs in the three networks exhibited spontaneous firing in the absence of excitation). These data further suggest that the heterogeneity in interneuronal populations can influence PC excitability, and may play a role in epileptiform activity.
Figure 8. Interneuronal heterogeneity and sudden changes in excitatory inputs.

A, the spiking of the PC is illustrated, in response to varying excitation levels. The frequency of the incoming EPSPs to the network was changed in a step-wise manner, as indicated in the bottom row. The homogeneous networks included 25 NA or SA interneurones, while the heterogeneous network had 25 INs with an equal mixture of the five cell types with different action potential adaptations (as in Fig. 1). In this and subsequent simulation figures, the number of PCs was five. B, different behaviours of the PCs inhibited by homo- versus heterogeneous networks. The network included PC-to-PC collaterals. Note that the incoming excitation was stopped after the period of increased excitation (i.e. the incoming EPSP frequency was 0 Hz, as indicated in the bottom right-hand panel, and by the asterisk), but the PCs in the homogeneous networks continued to fire. In B and in Figs 9 and 10, where PC-to-PC connections were included, the neighbouring PCs were mutually coupled, and the first and the last PCs were also connected (to simulate the processes occurring in larger networks). In contrast, the interneurones were coupled in an all-to-all manner. Synaptic conductance values were: g1 = 11 nS, g2 = 1.2 nS, g3 = 1.4 nS, PC-PC = 100 nS, PC-IN = 2 nS, IN-IN = 0.2 nS. The number of network simulations (at least 1 s long) carried out in relation to the findings presented in this figure was 18, and the PC-PC connection was varied between 5 and 150 nS, and g1 was varied between 5 and 20 nS. Sustained post-excitation firing of the PCs connected to the HOM networks, with no excitation present (as in B), took place only when the PC-PC connections were strong (> 50 nS).
Variance and interneuronal synchrony
Closely phase-locked discharges by hippocampal interneurones play a central role in generating theta and gamma membrane potential oscillations in PCs (Buzsáki et al. 1983; Lytton & Sejnowski, 1991; Soltesz & Deschênes, 1993; Sik et al. 1995; Ylinen et al. 1995; Cobb et al. 1995; Traub et al. 1996, 1999; Fisahn et al. 1998; White et al. 2000). Since the role for temporal dispersion of interneuronal discharges was indicated by the previous simulation data, the influence of interneuronal synchrony on PC firing was further examined in the setting of ‘spontaneous’ theta and gamma oscillations. The slow muscarinic septal input (known to be necessary for the theta rhythm) to PCs and interneurones was simulated by a steady-state depolarization (McQuiston & Madison, 1999). A mixture of 100, 200 and 500 Hz EPSPs (in 1: 1: 1 ratio) was included as a background excitation to both PCs and interneurones. In these and subsequent simulations, the HET interneurones did not contain the five physiological classes defined in Fig. 1; instead, each of the 25 interneurones in the HET population was assigned a unique pair of gSK and gNCa values, with a uniform distribution around the mean (see legend to Fig. 9).
As illustrated in Fig. 9Aa, homogeneous interneurones (HOM-NA cells), mutually interconnected by inhibitory synapses, were perfectly synchronized at the gamma frequency, whereas the heterogeneous interneuronal population was less synchronized (Fig. 9Ba). Note that the gamma oscillation was not forced onto the network from the outside, but it was produced by the network of mutually interconnected interneurones itself (e.g. Wang & Buzsáki, 1996; basically, the coupling has to be strong enough to synchronize the interneurones, but not so strong that it suppresses interneuronal activity). As expected from the strong synchrony of the homogeneous interneurones, the IPSPs in the PCs appeared as large intracellular membrane potential oscillations at around 40 Hz (Fig. 9Ab). The less synchronized HET interneurones resulted in slower rising and smaller membrane potential oscillations in the PCs (Fig. 9Bb). Therefore, heterogeneity decreased interneuronal synchrony (Golomb & Rinzel, 1993; Wang & Buzsáki, 1996; White et al. 1998; Tiesinga & Jose, 2000), and decreased the amplitude of the intracellular membrane potential oscillations in the PCs.
Next, the degree of heterogeneity in the already heterogeneous interneuronal population was increased. This was achieved by increasing the distance between the two extremes along the NA-SA axis (by further increasing and decreasing the levels of ion channel expression affecting adaptation properties, as described in the legend to Fig. 9). Importantly, the additional increase in the variance in interneuronal properties did not change the mean of the conductance values for the ion channels across the HET interneuronal population. As illustrated in Fig. 9, the enhanced variance alone, even without a change in the mean, caused a decrease in the synchrony of interneuronal firing (Fig. 9Ba and Ca), and a virtual disappearance of the 40 Hz oscillations in the PCs (Fig. 9Bb and Cb). In addition, because of the interneurone-to-interneurone coupling, the asynchronous firing of the interneurones in the heterogeneous networks could lead to inhibition of interneurones by interneurones (as discussed above in relation to Fig. 8). In the interneuronal network with the highest variance (Fig. 9Ca), there were several interneurones that remained silent, mostly as a result of inhibition of SA cells by the more excitable NA interneurones.
The average membrane potential value of the PCs shifted closer to firing threshold as the variance in the interneuronal firing properties was increased (Fig. 9Ab, Bb and Cb), because the larger IPSPs could bring the PCs' membrane potential closer to ECl in the case of the more synchronously discharging interneuronal network. In addition, alterations in the variance of interneuronal ion channel expression affected how PCs responded to enhanced EPSP inputs during the 40 Hz oscillations (Fig. 9, bottom three panels). The PCs postsynaptic to the HOM-NA interneuronal network reached firing threshold easier than the PCs in the HET networks, even though the average membrane potential values of the PCs in the HOM-NA network were more hyperpolarized. These results indicate that the temporal dispersion of IPSPs, rather than the absolute amplitude of the IPSPs alone, is the important factor in the modulation of the transition from subthreshold to suprathreshold behaviour of PCs by the interneuronal network (however, the amplitude of the IPSPs can be a decisive factor in suppressing spiking in a network with PCs that discharge at high initial frequencies, see below).
Similar results were obtained when, in addition to 40 Hz oscillations, the theta rhythm was also represented in the model. Rhythmic, low frequency (around 5 Hz, i.e. in the theta range) amplitude modulation of the postsynaptic intracellular gamma rhythm was generated by IPSPs arriving on hippocampal interneurones in short bursts (each burst consisted of four IPSPs at 40 Hz, and the inter-burst interval was 200 ms) (Soltesz & Deschênes, 1993; Ylinen et al. 1995; Lisman & Idiart, 1995), simulating the effect of the septo-hippocampal GABAergic inputs that exclusively target interneurones (Freund & Antal, 1988). As illustrated in Fig. 10A and B, there was a difference in spontaneous firing rates of PCs connected to HOM-NA versus HET interneuronal populations. As in the previous set of simulations, the PCs in the HOM-NA network were more excitable, since they showed higher spontaneous firing rates (Fig. 10A) than the HET network (Fig. 10B), in spite of the fact that NA interneurones were able to discharge at the highest frequencies and were the most excitable interneurones. When variance was introduced into the purely HOM-NA interneuronal population, by scattering the resting membrane potential values of the NA interneurones around an unchanged mean, the increased variance alone changed the spontaneous firing rates of the PCs (compare Fig. 10A and C). These results further suggest that changes in interneuronal variance, even in the absence of alterations in mean values, can modify, through the temporal properties of interneuronal action potential discharges, both the spontaneous and the evoked firing rates of PCs.
Figure 10. Influence of variance in interneuronal populations on spontaneous PC firing rates during theta-gamma oscillations.

A and B, schematic diagram indicating that the interneurones in these simulations received a theta-modulated inhibitory input (four IPSPs at 40 Hz, every 200 ms), simulating the septo-hippocampal GABAergic drive specific to hippocampal interneurones. With the same synaptic connectivity values in the HOM and HET cases, the PCs in the HOM-NA network exhibited spontaneous discharges (in A), whereas the PCs connected to the HET interneuronal population (in B) remained subthreshold. C, when the HOM-NA interneurones (same as in A) received depolarizing or hyperpolarizing constant current inputs to scatter their resting membrane potentials by ± 2.5 mV, without a change in the mean resting membrane potential of the interneuronal population, the behaviour of PCs was affected (compare A and C). The synaptic conductance values were as in Fig. 9; the septal GABAergic input was 100 nS. The background excitation was a mixture of 100, 200 and 500 Hz EPSPs in 1 : 1 : 2 proportion. Additional simulations explored the parameter space, with results essentially similar to those illustrated in the figure, within the following parameter values: Idepol-PC: 0.01–0.15 nA; g1 = 0.05–10 nS at 100, 200 and 500 Hz; g2 = 0.0–1.2 nS; g3 = 1.4–8 nS; PC-PC: 1.4–5 nS; Idepol-IN: 0.15 nA; septum-GABA-IN: 0.2–300 nS; PC-IN: 1–20 nS; IN-IN: 3–80 nS. The number of network simulations carried out in connection with the findings illustrated in this figure was 86.
Interneuronal variance and principal cell synchrony
What is the effect of changes in interneuronal variance on the synchrony of PCs? In the previous simulations, either a single PC, or several interconnected but identical PCs were included in the model. To study the role of interneuronal variance on PC synchrony, each PC received different amounts of steady-state depolarizing currents, leading to asynchrony in the spontaneous discharges of PCs in the absence of inhibitory inputs (Fig. 11Ab). In addition, the collaterals between the PCs and from the PCs to the interneurones were also removed (so that the degree of PC synchrony could not back-propagate and influence the interneuronal discharges) (Fig. 11Aa). The first row in Fig. 11 shows the discharges of the three populations of interneurones (HOM-NA, HET and HET with increased variance), similar to those described in Fig. 9. As illustrated in the second row of panels (Fig. 11Bb, Cb and Db), changes in the variance of ion channel expression level in the interneuronal population influenced not only the interneuronal, but the PC synchrony as well. The large, synchronized IPSPs in the PCs connected to the less heterogeneous interneuronal population were able to strongly suppress PC spiking (compared with the no-inhibition case, Fig. 11Ab), and thus synchronize the firing of the PCs more robustly than in the case of the interneurones that differed from one another in their physiological properties. The role of variance in interneuronal ion channel expression is especially clearly demonstrated by the comparison of the HET and the ‘HET-increased variance’ cases, where the virtually complete loss of PC synchrony (Fig. 11Cb and Db) occurred in response to altered variance only, without any change in the mean level of ion channel expression in the interneuronal population.
The simulations illustrated in Fig. 9 and Fig. 11 also indicate that the increased temporal dispersion of interneuronal firing, due to increased variance in interneuronal populations, can have opposite effects on PC excitability, depending on the initial conditions. When the PCs are mostly subthreshold and are challenged by a strong excitatory stimulus (as in Fig. 9), the PCs connected to the homogeneous interneuronal population can increase their firing rates towards a maximum set by the large, synchronous IPSPs (Fig. 9Ac). However, when the PCs are discharging at a rate that is higher than 40 Hz (as in Fig. 11Ab), the large IPSPs originating from the homogeneous interneurones can powerfully decrease PC spiking, towards the frequency of the synchronized IPSPs (average PC firing rates in Fig. 11: panel Ab: 224 Hz; Bb: 46 Hz; Cb: 56 Hz; Db: 178 Hz). The smaller, temporally dispersed IPSPs in the PCs connected to the HET networks (Fig. 11Da and Db) decreased PC firing to a lesser degree than the large, synchronized IPSPs originating from the synchronized discharges of the HOM-NA interneurones, because the smaller, asynchronous IPSPs were not powerful enough to suppress the action potential generation in the strongly depolarized PCs (Fig. 11Aa). Therefore, although these data further support that changes in variance in interneuronal populations can modulate PC behaviour, the results shown in Fig. 9 and Fig. 11 also indicate, in agreement with the previous results (e.g. Figs 2, 5 and 6), that the ultimate effect of interneuronal variance (i.e. whether increased variance causes increased or decreased PC firing) depends on parameter values and initial conditions.
In the simulations discussed so far, the PC model was a simple, two-channel model (with the exception of the model in Fig. 3, which also included the h-current). As pointed out above, the magnitude, and even the direction, of the effects of alterations in the variance of interneuronal properties could depend on several factors, including the properties of PCs. Therefore, an unresolved question is whether changes in the variance of interneuronal populations would also affect the firing and synchrony of more complex PCs that are closer to the biological situation in possessing a wider array of voltage-gated ion channels. The complex, bursting CA3 cell model of Traub et al. (1991) includes six voltage-gated ion channels, and it has been shown to closely mimic the behaviour of real pyramidal cells. As illustrated in Fig. 11 (bottom panels), when these CA3 cells were used instead of the simpler PCs, the results were essentially similar to those obtained with the simpler PCs. Again, differing amount of steady depolarizing current was injected into the individual CA3 cells, resulting in desynchronized firing by the simulated pyramidal cells without inhibitory inputs (Fig. 11Ac). When these asynchronously firing CA3 cells were coupled to the HOM-NA interneurones, the discharge pattern of the pyramidal cells slowed down and their degree of synchrony was greatly increased, compared with the no-inhibition case (Fig. 11Bc). As in the case of the simpler PCs, increased heterogeneity in the interneuronal ion channel expression levels resulted in a decrease in the synchronization of the CA3 pyramidal cells (Fig. 11Bc, Cc and Dc).
Evidence that interneuronal variance can change in epilepsy
The simulation results presented in this paper suggest that altered variance in interneuronal populations may affect PC behaviour. But is there any evidence that variance in any interneuronal property studied here can indeed undergo changes in a real, biological situation? Since we are not aware of any such data from the literature, we examined the resting membrane potential values of interneurones in two different models of experimental epilepsy: post-traumatic hyperexcitability (Toth et al. 1997) and prolonged febrile seizures (Chen et al. 1999). Shortly after experimental moderate concussive head trauma (fluid percussion injury), the resting membrane potential of interneurones located in the granule cell layer of the dentate gyrus has been shown to undergo a long-lasting depolarizing shift, which enhances the ability of incoming excitatory signals to discharge interneurones (Ross & Soltesz, 2000, 2001). In spite of the shift in the mean, there was no obvious change in the variance in the resting membrane potential values between the control and the experimental interneuronal populations (Fig. 12A; note that these data are from a larger sample than in Ross & Soltesz, 2000). Figure 12A shows box plots of these data (the line in the middle of the box plots show the median, the shaded ‘box’ contains 50 % of the data points indicating the spread of the data, and the ‘whiskers’ sticking out from the boxes show the maximum and minimum values). Note that 50 % of the interneurones differed from each other by less than 8 mV in both the control and in the post-traumatic groups. In contrast, interneurones in the stratum oriens layer in CA1 one week after prolonged experimental febrile seizures (Chen et al. 1999) indicated the opposite scenario, i.e. virtually identical means, but enlarged variances (Fig. 12B). In the latter case, 50 % of the interneurones were within 5 mV in control, but this value increased to 12 mV after febrile seizures.
Figure 12. Experimental evidence for altered variance in interneuronal populations in epilepsy.

A, the resting membrane potentials of interneurones in the granule cell layer of the dentate gyrus show a significant depolarizing shift after a single episode of moderate concussive head trauma (Toth et al. 1997; Ross & Soltesz, 2000). Note that, in this case, only the mean value of the resting membrane potential changed significantly. Con, age-matched, sham-injured controls; Exp, experimental group (after fluid percussion head injury). The analysis of the resting membrane potential was done from samples of 20 s as described in Ross & Soltesz (2001). B, in contrast, the resting membrane potential of interneurones in the stratum oriens of the CA3 region from animals that experienced an episode of experimental prolonged febrile seizures (Exp) (Chen et al. 1999, 2001) did not show any significant alteration in the mean value of the population. However, there was a significant increase in the variance of the resting membrane potential values around the mean across the interneuronal population. In both A and B, box plots of the data are shown, illustrating the median (horizontal lines close to the middle of the shaded boxes), the 50 % of the data around the mean value (shown by the shaded boxes), and the minimum and maximum values (indicated by the vertical ‘whiskers’ sticking out from the boxes). The mean values and the population variance, together with the number of recorded interneurones (n), are shown below the box plots. Statistical analysis of the data (see Results) showed a significant (P < 0.05) change in the mean in A (with Student's t test or the Kolmogorov-Smirnov test), and a significant change in the variance in B (with the variance ratio F test).
These results could also be supported by statistical methods. All four groups in Fig. 12 passed the Kolmogorov- Smirnov normality test. The two data groups in Fig. 12A were significantly different in their means as tested with Student's t test, and they were also significantly different with the Kolmogorov-Smirnov test (both at the P < 0.05 level), whereas there was no difference in means between the data groups in Fig. 12B. Since all four groups were sufficiently normal, the variance ratio F test (e.g. Zar, 1984) was warranted to test for differences in variances. The variance ratio F test showed significant difference between the control and experimental groups after febrile seizure (Fig. 12B), but there was no difference between the control versus trauma groups in Fig. 12A. (The non-parametric Conover Squared-Rank test, e.g. Sprent & Smeeton (2001), which compares the variance of two groups without making assumptions about normality, agreed with the conclusions based on the variance ratio F test.) Taken together, these data suggest that, in addition to the changes in means, variances in physiological properties of interneuronal populations may also undergo significant alterations in seizure paradigms.
DISCUSSION
Limitations and constraints
The following limitations and constraints apply to this study: (i) In order to demonstrate the general principle that changes in interneuronal variance can influence how PCs respond to excitatory inputs, the firing of PCs was examined in response to sustained excitatory inputs arriving at particular frequencies between 0 and 1000 Hz. Although real neurones can receive small groups of spontaneous EPSCs (sEPSCs) in the 1–10 ms range (e.g. Hollrigel et al. 1998), and presynaptic excitatory cells can discharge at high frequencies in short bursts during epileptiform discharges (e.g. Santhakumar et al. 2000), it is unlikely that real neurones would receive sustained sEPSPs at hundreds of hertz for prolonged periods. However, in order to calculate the firing rates in response to sEPSPs, it was necessary to study the effects of sustained inputs at each frequency. (ii) Although our PC and interneurone (IN) models have various biophysically based channels and representations of neuronal morphologies, they are considerably simpler than real cells and they were not constructed to represent particular hippocampal neuronal species (e.g. CA1 pyramidal cells or basket cells), with the exception of the CA3 model of Traub et al. (1991) studied in Fig. 11. This is mainly due to the fact that the PCs possessed only two or three channels in most simulations, in order to decrease computational demand. (iii) Although the data indicate that interneuronal variance can influence PC input-output relationships, it should be pointed out that there are many other ways that INs can modify PC firing rates apart from the mechanism studied here. (iv) Finally, although experimental data showed, for the first time, that interneuronal variances can change after seizures, it was not determined whether and how the increased variance in interneuronal resting membrane potential after febrile seizures contributed to the altered excitability of CA1 pyramidal cells after febrile seizures (Chen et al. 1999, 2001; Dube et al. 2000). However, these limitations do not alter the main conclusions of this study.
Interneuronal heterogeneity
Interneurones in the retina, neocortex and hippocampus have been reported to be astonishingly diverse (Ramon y Cajal, 1911; MacNeil & Masland, 1998; Parra et al. 1998; Gupta et al. 2000; Miles, 2000). Within each morphologically identified interneuronal class, a certain level of cell-to-cell variability exists in axonal target selection, as well as in physiological properties including spike frequency adaptation, resting membrane potential, input resistance (Lacaille & Schwartzkroin, 1988; Spruston et al. 1997; Ali et al. 1999; Gupta et al. 2000), and the expression of receptors for neurotransmitters and neuromodulators (McBain & Dingledine, 1993; McBain et al. 1994; Bergles et al. 1996; McMahon & Kauer, 1997; Miller et al. 1997; Morales & Bloom, 1997; Parra et al. 1998; Svoboda et al. 1999; McQuiston & Madison, 1999; Thomson et al. 2000). Additional sources of variability may include differences in dendritic geometry (Mainen & Sejnowksi, 1996), heterogeneity in the number of postsynaptic GABAA receptors (Nusser et al. 1997), differences in IPSC decay time constants (Jones & Westbrook, 1997; Banks et al. 2000; Maccaferri et al. 2000), and in the presynaptic control of GABA release (Caillard et al. 1999). While it seems plausible that some variance exists in all of these parameters of interneuronal anatomy and physiology, little attention has been given to a possible influence of such population-level heterogeneities on the regulation of principal cell discharges.
This paper aimed to shed some light on two issues. First, we set out to determine whether alterations in variances in interneuronal properties, especially without changes in means, could result in changes in the input-output functions of principal cells. Since currently there is no method developed to exclusively change the variance, but not the mean, of some property in real interneuronal populations, biophysically based simulation techniques were employed to seek answers to the first aim. Second, we wanted to find at least one example of a changed variance (preferably, without a change in the mean) for a functionally relevant interneuronal property in a real neuronal circuit.
Changes in variance and/or mean of interneuronal population parameters
As shown above, the simulation data suggest that changes in variance in a presynaptic interneuronal population can significantly alter the way PCs respond to excitatory inputs, or how they behave during gamma and theta oscillations in terms of sub- or suprathreshold events and synchrony. The main implication of these findings is that attention should be paid in future experimental studies to the possibility that a given manipulation (e.g. a drug, stimulation of afferents, or injury) may cause no apparent change in mean values of interneuronal parameters, but may still affect principal cell behaviours through altering the population variance of interneurones. It is quite possible that, with the past and current focus on mean values, potentially important modifications in interneuronal parameters were missed, e.g. in epilepsy research. It is only after one becomes aware of the possibility that a change in a parameter in a network of interneurones can manifest itself as altered variance, which, in turn, may affect principal cell behaviours, that one can begin to examine variance values before and after a manipulation. Our data from experimental febrile seizures indicate, for the first time, that changes in variance in a parameter in an interneuronal population indeed can take place in a neurological disorder. The alteration in the variance of the resting membrane potentials of the stratum oriens interneurones after febrile seizures was long-lasting (at least as long as one week), and, in this particular case, it took place without any alterations in the mean values (control: −62 mV; experimental: −62.3 mV).
Limitations of predicting the effects of altered interneuronal variance
Although our simulation results indicate the possibility of a causative connection between changed interneuronal variance and modified principal cell output, these findings also suggest that the quantitative, and even the qualitative aspects of the effects of altered interneuronal variance on PC behaviour depend on parameter values (e.g. connectivity patterns, and interneuronal and PC channel expression). In other words, our simulation results indicate that there is no general rule that could predict the final outcome of altered interneuronal variance, since increased heterogeneity in an interneuronal population can either increase or decrease principal cell excitability, depending on many factors. For example, in Fig. 1Ba, the heterogeneous interneuronal network suppressed the spiking of the PC less or more than the HOM-NA interneurones, depending on the frequency of excitatory inputs. Also, although the HET networks caused greater suppression of PC firing in Fig. 2 at most synaptic conductance values, this might not have been the case if the calculations had taken into account the average PC spiking values in response to lower EPSP frequencies only. For example, in the 0–100 Hz EPSP interval, the HOM-NA network, due to the low ‘critical frequency’ of NA cells, most often (but not always, see Fig. 3) caused greater inhibition of PC spiking than the HET interneurones (Fig. 1Ba and Fig. 4). Furthermore, in Fig. 8A, the PC firing rate before the step from 50 Hz was lower in the HOM-NA case, but it was the highest in the HOM-NA network during the step to 600 Hz, illustrating the dependence of the effect of heterogeneity on the EPSP frequency. The degree of PC spike suppression at the various input frequencies was determined by the intrinsic properties of the interneurones (manifesting itself as the ‘critical frequency’; Fig. 1Bb), the temporal dispersion of the interneuronal spiking (Fig. 1 and Fig. 4), and by the intrinsic properties of the PCs (Fig. 3). Therefore, although the present simulation results indicate, in a general sense, that altered variance (e.g. in ion channel expression levels) in interneurones can influence PC behaviour, the direction and magnitude of the final effects have to be determined on a case-by-case basis.
In the cases of input frequency (Fig. 5), resting membrane potential (Fig. 6A) and leak conductance (Fig. 6B), the results further indicated that increases in interneuronal variance can cause highly non-linear effects, and that variance in these interneuronal properties can display ‘optimum’ values in terms of PC spike suppression (note that maximal suppression of PC spiking by interneurones is not necessarily an ‘optimal’ state from the point of view of the normal functioning of the network). The degree of dispersion around the mean for key parameters in real interneuronal populations is not yet clearly determined, and how altered variances in particular interneuronal parameters (e.g. in resting membrane potential, as in Fig. 12B) affect real principal cell behaviours will also need to be investigated in the future. Since many parameters may change, either in their means and/or variances, in biological models of neurological disorders such as in the febrile seizure model (Chen et al. 1999, 2001), it seems that the next step towards understanding how changes in variance in interneuronal parameters affect principal cell behaviours will be to develop techniques to modulate experimentally interneuronal heterogeneity, without altering the mean, under controlled conditions.
Network behaviour and interneuronal heterogeneity
Previously, the effects of heterogeneity in interneuronal networks were studied mainly in relation to how heterogeneity influences synchronous firing among interneurones. Interneuronal populations can be synchronized by purely inhibitory couplings (Wang & Rinzel, 1993; van Vreeswijk et al. 1994), and the degree of synchrony has been shown to decrease following the introduction of heterogeneity among the interneurones (Golomb & Rinzel, 1993; Wang & Buzsáki, 1996; White et al. 1998; Tiesinga & José, 2000). Our results (illustrated in Fig. 9 and Fig. 11) are in agreement with these findings regarding gamma genesis by interneuronal networks, and emphasize the desynchronizing effect of heterogeneity in interneuronal populations. In addition, the present simulations also showed that the decrease in interneuronal synchrony with increasing heterogeneity can cause a variety of effects, including alterations in the amplitude and frequency of intracellular membrane potential oscillations (Fig. 9), shifts in the average membrane potential values (Fig. 9), and modifications of the spontaneous firing rates of PCs (Fig. 10 and Fig. 11), as well as of the rates of PC discharges in response to sudden changes in incoming EPSP frequencies (Fig. 9). As the findings illustrated in Fig. 9 and Fig. 11 indicate, the direction of the changes in PC firing rates resulting from increased interneuronal variance also depended on parameter values (e.g. in the initial rate of PC discharges).
Furthermore, the simulations also suggested that, in addition to affecting interneuronal synchrony and PC membrane potential oscillations, the degree of heterogeneity in interneuronal networks influenced the synchrony of principal cells as well. These results indicate that the possible contribution of alterations in interneuronal population variance to hyper-synchronous discharges in epileptic tissue should be considered. It is an interesting possibility in this regard that certain neurotransmitters and neuromodulators may dynamically regulate the physiological variability of interneuronal networks in a state-dependent manner, since differences in the degree of innervation by neuromodulatory presynaptic fibres, receptor expression, or second messenger concentrations, probably exist within a population of interneurones. Activation of septal muscarinic inputs, for example, may lead to slightly more depolarization in one somatically projecting interneurone compared with its neighbour (e.g. as shown by McQuiston & Madison, 2000), potentially altering the variability in the resting membrane potentials within the population. Indeed, this prediction may be testable in vitro by measuring alterations in variance in the properties of interneurones before and after application of neuromodulators. The present modelling results suggest that, at least in principle, novel ways of enhancing the inhibitory control of PC discharges in epileptic networks may exist through the pharmacological control of the amount of variance in interneuronal populations.
Acknowledgments
This work was supported by the NIH (grant NS35951 to I. S.). I. A. was partially supported by a Postdoctoral Research Fellowship from the American Epilepsy Society. The authors thank Dr P. Somogyi for detailed discussions on the meaning and extent of interneuronal heterogeneity, Drs S. T. Ross and N. Thon for assistance with the interneuronal recordings, and Dr M. Turner for expert advice on statistics.
REFERENCES
- Ali AB, Bannister AP, Thomson AM. IPSPs elicited in CA1 pyramidal cells by putative basket cells in slices of adult rat hippocampus. European Journal of Neuroscience. 1999;11:1741–1753. doi: 10.1046/j.1460-9568.1999.00592.x. [DOI] [PubMed] [Google Scholar]
- Aradi I, Holmes WR. Active dendrites regulate spatio-temporal synaptic integration in hippocampal dentate granule cells. Neurocomputing. 1999a;26:45–51. [Google Scholar]
- Aradi I, Holmes WR. Role of multiple calcium and calcium-dependent conductances in regulation of hippocampal dentate granule cell excitability. Journal of Computational Neuroscience. 1999b;6:215–235. doi: 10.1023/a:1008801821784. [DOI] [PubMed] [Google Scholar]
- Banks MI, White JA, Pearce RA. Interactions between distinct GABAA circuits in hippocampus. Neuron. 2000;25:449–457. doi: 10.1016/s0896-6273(00)80907-1. [DOI] [PubMed] [Google Scholar]
- Baram TZ, Gerth A, Schultz L. Febrile seizures: an appropriate-aged model suitable for long-term studies. Developmental Brain Research. 1997;98:265–270. doi: 10.1016/s0165-3806(96)00190-3. [DOI] [PMC free article] [PubMed] [Google Scholar]
- Bergles DE, Doze VA, Madison DV, Smith SJ. Excitatory actions of norepinephrine on multiple classes of hippocampal CA1 interneurons. Journal of Neuroscience. 1996;16:572–585. doi: 10.1523/JNEUROSCI.16-02-00572.1996. [DOI] [PMC free article] [PubMed] [Google Scholar]
- Buckmaster PS, Soltesz I. Neurobiology of hippocampal interneurons: a workshop review. Hippocampus. 1996;6:330–339. doi: 10.1002/(SICI)1098-1063(1996)6:3<330::AID-HIPO9>3.0.CO;2-Q. [DOI] [PubMed] [Google Scholar]
- Buhl EH, Cobb SR, Halasy K, Somogyi P. Properties of unitary IPSPs evoked by anatomically identified basket cells in the rat hippocampus. European Journal of Neuroscience. 1995;7:1989–2004. doi: 10.1111/j.1460-9568.1995.tb00721.x. [DOI] [PubMed] [Google Scholar]
- Buhl EH, Halasy K, Somogyi P. Diverse sources of hippocampal unitary inhibitory postsynaptic potentials and the number of synaptic release sites. Nature. 1994a;368:823–828. doi: 10.1038/368823a0. [DOI] [PubMed] [Google Scholar]
- Buhl EH, Han ZS, Louml;rinczi Z, Stezhka VV, Karnup SV, Somogyi P. Physiological properties of anatomically identified axo-axonic cells in the rat hippocampus. Journal of Neurophysiology. 1994b;71:1289–1307. doi: 10.1152/jn.1994.71.4.1289. [DOI] [PubMed] [Google Scholar]
- Buzsáki G, Leung LW, Vanderwolf CH. Cellular bases of hippocampal EEG in the behaving rat. Brain Research. 1983;287:139–171. doi: 10.1016/0165-0173(83)90037-1. [DOI] [PubMed] [Google Scholar]
- Caillard O, Ben-Ari Y, Gaïarsa JL. Mechanisms of induction and expression of long-term depression at GABAergic synapses in the neonatal rat hippocampus. Journal of Neuroscience. 1999;19:7568–7577. doi: 10.1523/JNEUROSCI.19-17-07568.1999. [DOI] [PMC free article] [PubMed] [Google Scholar]
- Chen K, Aradi I, Thon N, Eghbal-Ahmadi M, Baram TZ, Soltesz I. Persistently modified H-channels after complex febrile seizures convert the seizure-induced enhancement of inhibition to hyperexcitability. Nature Medicine. 2001;7:331–336. doi: 10.1038/85480. [DOI] [PMC free article] [PubMed] [Google Scholar]
- Chen K, Baram TZ, Soltesz I. Febrile seizures in the developing brain result in persistent modification of neuronal excitability in limbic circuits. Nature Medicine. 1999;5:888–894. doi: 10.1038/11330. [DOI] [PMC free article] [PubMed] [Google Scholar]
- Cobb SR, Buhl EH, Halasy K, Paulsen O, Somogyi P. Synchronization of neuronal activity in hippocampus by individual GABAergic interneurons. Nature. 1995;378:75–78. doi: 10.1038/378075a0. [DOI] [PubMed] [Google Scholar]
- Dixon CE, Lyeth BG, Povlishock JT, Findling RL, Hamm RJ, Marmarou A, Young HF, Hayes RL. A fluid percussion model of experimental brain injury in the rat. Journal of Neurosurgery. 1989;67:110–119. doi: 10.3171/jns.1987.67.1.0110. [DOI] [PubMed] [Google Scholar]
- Dube C, Chen K, Eghbal-Ahmadi M, Brunson K, Soltesz I, Baram TZ. Prolonged febrile seizures in the immature rat model enhance hippocampal excitability long term. Annals of Neurology. 2000;47:336–344. [PMC free article] [PubMed] [Google Scholar]
- Fisahn A, Pike FG, Buhl EH, Paulsen O. Cholinergic induction of network oscillations at 40 Hz in the hippocampus in vitro. Nature. 1998;394:186–189. doi: 10.1038/28179. [DOI] [PubMed] [Google Scholar]
- Freund TF, Antal M. GABA-containing neurons in the septum control inhibitory interneurons in the hippocampus. Nature. 1988;336:170–173. doi: 10.1038/336170a0. [DOI] [PubMed] [Google Scholar]
- Freund TF, Buzsáki G. Interneurons of the hippocampus. Hippocampus. 1996;6:347–740. doi: 10.1002/(SICI)1098-1063(1996)6:4<347::AID-HIPO1>3.0.CO;2-I. [DOI] [PubMed] [Google Scholar]
- Geiger JR, Lübke J, Roth A, Frotscher M, Jonas P. Submillisecond AMPA receptor-mediated signaling at a principal neuron-interneuron synapse. Neuron. 1997;18:1009–1023. doi: 10.1016/s0896-6273(00)80339-6. [DOI] [PubMed] [Google Scholar]
- Golomb D, Rinzel J. Dynamics of globally coupled inhibitory neurons with heterogeneity. Physical Review E. 1993;48:4810–4814. doi: 10.1103/physreve.48.4810. [DOI] [PubMed] [Google Scholar]
- Gulyás AI, Miles R, Hájos N, Freund TF. Precision and variability in postsynaptic target selection of inhibitory cells in the hippocampal CA3 region. European Journal of Neuroscience. 1993;5:1729–1751. doi: 10.1111/j.1460-9568.1993.tb00240.x. [DOI] [PubMed] [Google Scholar]
- Gupta A, Wang Y, Markram H. Organizing principles for a diversity of GABAergic interneurons and synapses in the neocortex. Science. 2000;287:273–278. doi: 10.1126/science.287.5451.273. [DOI] [PubMed] [Google Scholar]
- Hájos N, Mody I. Synaptic communication among hippocampal interneurons: properties of spontaneous IPSCs in morphologically identified cells. Journal of Neuroscience. 1997;17:8427–8442. doi: 10.1523/JNEUROSCI.17-21-08427.1997. [DOI] [PMC free article] [PubMed] [Google Scholar]
- Halasy K, Buhl EH, Lörinczi Z, Tamás G, Somogyi P. Synaptic target selectivity and input of GABAergic basket and bistratified interneurons in the CA1 area of the rat hippocampus. Hippocampus. 1996;6:306–329. doi: 10.1002/(SICI)1098-1063(1996)6:3<306::AID-HIPO8>3.0.CO;2-K. [DOI] [PubMed] [Google Scholar]
- Halasy K, Somogyi P. Subdivisions in the multiple GABAergic innervation of granule cells in the dentate gyrus of the rat hippocampus. European Journal of Neuroscience. 1993;5:411–429. doi: 10.1111/j.1460-9568.1993.tb00508.x. [DOI] [PubMed] [Google Scholar]
- Han ZS, Buhl EH, Lörinczi Z, Somogyi P. A high degree of spatial selectivity in the axonal and dendritic domains of physiologically identified local-circuit neurons in the dentate gyrus of the rat hippocampus. European Journal of Neuroscience. 1993;5:395–410. doi: 10.1111/j.1460-9568.1993.tb00507.x. [DOI] [PubMed] [Google Scholar]
- Hines M, Carnevale NT. Computer modeling methods for neurons. In: Arbib MA, editor. The Handbook of Brain Theory and Neural Networks. MA, USA: MIT Press, Cambridge; 1995. pp. 226–230. [Google Scholar]
- Hines ML, Carnevale NT. The NEURON simulation environment. Neural Computation. 1997;9:1179–1209. doi: 10.1162/neco.1997.9.6.1179. [DOI] [PubMed] [Google Scholar]
- Hollrigel GS, Chen K, Baram TZ, Soltesz I. The pro-convulsant actions of corticotropin-releasing hormone in the hippocampus of infant rats. Neuroscience. 1998;84:71–79. doi: 10.1016/s0306-4522(97)00499-5. [DOI] [PMC free article] [PubMed] [Google Scholar]
- Jaffe DB, Ross WN, Lisman JE, Lasser-Ross N, Miyakawa H, Johnston D. A model for dendritic Ca2+ accumulation in hippocampal pyramidal neurons based on fluorescence imaging measurements. Journal of Neurophysiology. 1994;71:1065–1077. doi: 10.1152/jn.1994.71.3.1065. [DOI] [PubMed] [Google Scholar]
- Jones MV, Westbrook GL. Shaping of IPSCs by endogenous calcineurin activity. Journal of Neuroscience. 1997;17:7626–7633. doi: 10.1523/JNEUROSCI.17-20-07626.1997. [DOI] [PMC free article] [PubMed] [Google Scholar]
- Kneisler TB, Dingledine R. Synaptic input from CA3 pyramidal cells to dentate basket cells in rat hippocampus. Journal of Physiology. 1995a;487:125–146. doi: 10.1113/jphysiol.1995.sp020866. [DOI] [PMC free article] [PubMed] [Google Scholar]
- Kneisler TB, Dingledine R. Spontaneous and synaptic input from granule cells and the perforant path to dentate basket cells in the rat hippocampus. Hippocampus. 1995b;5:151–164. doi: 10.1002/hipo.450050302. [DOI] [PubMed] [Google Scholar]
- Lacaille JC, Schwartzkroin PA. Stratum lacunosum-moleculare interneurons of hippocampal CA1 region. I. Intracellular response characteristics, synaptic responses, and morphology. Journal of Neuroscience. 1988;8:1400–1410. doi: 10.1523/JNEUROSCI.08-04-01400.1988. [DOI] [PMC free article] [PubMed] [Google Scholar]
- Li XG, Somogyi P, Tepper JM, Buzsáki G. Axonal and dendritic arborization of an intracellularly labeled chandelier cell in the CA1 region of rat hippocampus. Experimental Brain Research. 1992;90:519–525. doi: 10.1007/BF00230934. [DOI] [PubMed] [Google Scholar]
- Lisman JE, Idiart MA. Storage of 7 ± 2 short-term memories in oscillatory subcycles. Science. 1995;267:1512–1515. doi: 10.1126/science.7878473. [DOI] [PubMed] [Google Scholar]
- Lowenstein DH, Thomas MJ, Smith DH, McIntosh TK. Selective vulnerability of dentate hilar neurons following traumatic brain injury: a potential mechanistic link between head trauma and disorders of the hippocampus. Journal of Neuroscience. 1992;12:4846–4853. doi: 10.1523/JNEUROSCI.12-12-04846.1992. [DOI] [PMC free article] [PubMed] [Google Scholar]
- Lytton WW, Sejnowski TJ. Simulations of cortical pyramidal neurons synchronized by inhibitory interneurons. Journal of Neurophysiology. 1991;66:1059–1079. doi: 10.1152/jn.1991.66.3.1059. [DOI] [PubMed] [Google Scholar]
- McBain CJ, DiChiara TJ, Kauer JA. Activation of metabotropic glutamate receptors differentially affects two classes of hippocampal interneurons and potentiates excitatory synaptic transmission. Journal of Neuroscience. 1994;14:4433–4445. doi: 10.1523/JNEUROSCI.14-07-04433.1994. [DOI] [PMC free article] [PubMed] [Google Scholar]
- McBain CJ, Dingledine R. Heterogeneity of synaptic glutamate receptors on CA3 stratum radiatum interneurones of rat hippocampus. Journal of Physiology. 1993;462:373–392. doi: 10.1113/jphysiol.1993.sp019560. [DOI] [PMC free article] [PubMed] [Google Scholar]
- Maccaferri G, Roberts JD, Szucs P, Cottingham CA, Somogyi P. Cell surface domain specific postsynaptic currents evoked by identified GABAergic neurons in rat hippocampus in vitro. Journal of Physiology. 2000;524:91–116. doi: 10.1111/j.1469-7793.2000.t01-3-00091.x. [DOI] [PMC free article] [PubMed] [Google Scholar]
- McCormick DA, Wang Z, Huguenard J. Neurotransmitter control of neocortical neuronal activity and excitability. Cerebral Cortex. 1993;3:387–398. doi: 10.1093/cercor/3.5.387. [DOI] [PubMed] [Google Scholar]
- McIntosh TK, Vink R, Noble L, Yamakami I, Fernyak S, Soares H, Faden AL. Traumatic brain injury in the rat: characterization of a lateral fluid-percussion model. Neuroscience. 1989;28:233–244. doi: 10.1016/0306-4522(89)90247-9. [DOI] [PubMed] [Google Scholar]
- McMahon LL, Kauer JA. Hippocampal interneurons are excited via serotonin-gated ion channels. Journal of Neurophysiology. 1997;78:2493–2502. doi: 10.1152/jn.1997.78.5.2493. [DOI] [PubMed] [Google Scholar]
- MacNeil MA, Masland RH. Extreme diversity among amacrine cells: implications for function. Neuron. 1998;20:971–982. doi: 10.1016/s0896-6273(00)80478-x. [DOI] [PubMed] [Google Scholar]
- McQuiston AR, Madison DV. Muscarinic receptor activity has multiple effects on the resting membrane potentials of CA1 hippocampal interneurons. Journal of Neuroscience. 1999;15:5693–5702. doi: 10.1523/JNEUROSCI.19-14-05693.1999. [DOI] [PMC free article] [PubMed] [Google Scholar]
- Mainen ZF, Sejnowski TJ. Influence of dendritic structure on firing pattern in model neocortical neurons. Nature. 1996;382:363–366. doi: 10.1038/382363a0. [DOI] [PubMed] [Google Scholar]
- Markram H, Lübke J, Frotscher M, Roth A, Sakmann B. Physiology and anatomy of synaptic connections between thick tufted pyramidal neurones in the developing rat neocortex. Journal of Physiology. 1997;500:409–440. doi: 10.1113/jphysiol.1997.sp022031. [DOI] [PMC free article] [PubMed] [Google Scholar]
- Miles R. Diversity in inhibition. Science. 2000;287:244–246. doi: 10.1126/science.287.5451.244. [DOI] [PubMed] [Google Scholar]
- Miles R, Tóth K, Gulyás AI, Hájos N, Freund TF. Differences between somatic and dendritic inhibition in the hippocampus. Neuron. 1996;16:815–823. doi: 10.1016/s0896-6273(00)80101-4. [DOI] [PubMed] [Google Scholar]
- Miles R, Wong RK. Excitatory synaptic interactions between CA3 neurones in the guinea-pig hippocampus. Journal of Physiology. 1986;373:397–418. doi: 10.1113/jphysiol.1986.sp016055. [DOI] [PMC free article] [PubMed] [Google Scholar]
- Miller KK, Hoffer A, Svoboda KR, Lupica CR. Cholecystokinin increases GABA release by inhibiting a resting K+ conductance in hippocampal interneurons. Journal of Neuroscience. 1997;17:4994–5003. doi: 10.1523/JNEUROSCI.17-13-04994.1997. [DOI] [PMC free article] [PubMed] [Google Scholar]
- Morales M, Bloom FE. The 5-HT3 receptor is present in different subpopulations of GABAergic neurons in the rat telencephalon. Journal of Neuroscience. 1997;17:3157–3167. doi: 10.1523/JNEUROSCI.17-09-03157.1997. [DOI] [PMC free article] [PubMed] [Google Scholar]
- Mott DD, Turner DA, Okazaki MM, Lewis DV. Interneurons of the dentate-hilus border of the rat dentate gyrus: morphological and electrophysiological heterogeneity. Journal of Neuroscience. 1997;17:3390–4005. doi: 10.1523/JNEUROSCI.17-11-03990.1997. [DOI] [PMC free article] [PubMed] [Google Scholar]
- Nusser Z, Cull-Candy S, Farrant M. Differences in synaptic GABAA receptor number underlie variation in GABA mini amplitude. Neuron. 1997;19:697–709. doi: 10.1016/s0896-6273(00)80382-7. [DOI] [PubMed] [Google Scholar]
- Parra P, Gulyas AI, Miles R. How many subtypes of inhibitory cells in the hippocampus? Neuron. 1998;20:983–993. doi: 10.1016/s0896-6273(00)80479-1. [DOI] [PubMed] [Google Scholar]
- Ramon y Cajal S. Histologie du Systeme Nerveux de l'Homme et des Vertebres. Vol. 2. Paris: Maloine; 1911. [Google Scholar]
- Ross ST, Soltesz I. Selective depolarization of interneurons in the early posttraumatic dentate gyrus: involvement of the Na+/K+-ATPase. Journal of Neurophysiology. 2000;83:2916–2930. doi: 10.1152/jn.2000.83.5.2916. [DOI] [PubMed] [Google Scholar]
- Ross ST, Soltesz I. Long-term plasticity in interneurons of the dentate gyrus. Proceedings of the National Academy of Sciences of the USA. 2001;98:8874–8879. doi: 10.1073/pnas.141042398. [DOI] [PMC free article] [PubMed] [Google Scholar]
- Santhakumar V, Bender R, Frotscher M, Ross ST, Hollrigel GS, Toth Z, Soltesz I. Granule cell hyperexcitability in the post-traumatic rat dendate gyrus: The ‘Irritable Mossy Cell’ hypothesis. Journal of Physiology. 2000;524:117–134. doi: 10.1111/j.1469-7793.2000.00117.x. [DOI] [PMC free article] [PubMed] [Google Scholar]
- Scharfman HE. Electrophysiological diversity of pyramidal-shaped neurons at the granule cell layer/hilus border of the rat dentate gyrus recorded in vitro. Hippocampus. 1995;5:287–305. doi: 10.1002/hipo.450050403. [DOI] [PMC free article] [PubMed] [Google Scholar]
- Sik A, Penttonen M, Ylinen A, Buzsáki G. Hippocampal CA1 interneurons: an in vivo intracellular labeling study. Journal of Neuroscience. 1995;15:6651–6665. doi: 10.1523/JNEUROSCI.15-10-06651.1995. [DOI] [PMC free article] [PubMed] [Google Scholar]
- Soltesz I, Deschênes M. Low- and high-frequency membrane potential oscillations during theta activity in CA1 and CA3 pyramidal neurons of the rat hippocampus under ketamine-xylazine anesthesia. Journal of Neurophysiology. 1993;70:97–116. doi: 10.1152/jn.1993.70.1.97. [DOI] [PubMed] [Google Scholar]
- Sprent P, Smeeton NC. Applied Non-Parametric Statistical Methods. Boca Raton, FL, USA: Chapman & Hall/CRC; 2001. [Google Scholar]
- Spruston N, Johnston D. Perforated patch-clamp analysis of the passive membrane properties of three classes of hippocampal neurons. Journal of Neurophysiology. 1992;67:508–529. doi: 10.1152/jn.1992.67.3.508. [DOI] [PubMed] [Google Scholar]
- Spruston N, Lübke J, Frotscher M. Interneurons in the stratum lucidum of the rat hippocampus: an anatomical and electrophysiological characterization. Journal of Comparative Neurology. 1997;385:427–440. [PubMed] [Google Scholar]
- Staley KJ, Otis TS, Mody I. Membrane properties of dentate gyrus granule cells: comparison of sharp microelectrode and whole-cell recordings. Journal of Neurophysiology. 1992;67:1346–1358. doi: 10.1152/jn.1992.67.5.1346. [DOI] [PubMed] [Google Scholar]
- Svoboda KR, Adams CE, Lupica CR. Opioid receptor subtype expression defines morphologically distinct classes of hippocampal interneurons. Journal of Neuroscience. 1999;19:85–95. doi: 10.1523/JNEUROSCI.19-01-00085.1999. [DOI] [PMC free article] [PubMed] [Google Scholar]
- Thomson AM, Bannister AP, Hughes DI, Pawelzik H. Differential sensitivity to Zolpidem of IPSPs activated by morphologically identified CA1 interneurons in slices of rat hippocampus. European Journal of Neuroscience. 2000;12:425–436. doi: 10.1046/j.1460-9568.2000.00915.x. [DOI] [PubMed] [Google Scholar]
- Tiesinga PH, José JV. Robust gamma oscillations in networks of inhibitory hippocampal interneurons. Network. 2000;11:1–23. [PubMed] [Google Scholar]
- Toth Z, Hollrigel GS, Gorcs T, Soltesz I. Instantaneous perturbation of dentate interneuronal networks by a pressure wave-transient delivered to the neocortex. Journal of Neuroscience. 1997;17:8106–8117. doi: 10.1523/JNEUROSCI.17-21-08106.1997. [DOI] [PMC free article] [PubMed] [Google Scholar]
- Traub RD, Jefferys GR, Whittington MA. Fast Oscillations in Cortical Circuits. Cambridge, MA, USA: MIT Press; 1999. [Google Scholar]
- Traub RD, Whittington MA, Colling SB, Buzsáki G, Jefferys JGR. Analysis of gamma rhythms in the rat hippocampus in vitro and in vivo. Journal of Physiology. 1996;493:471–484. doi: 10.1113/jphysiol.1996.sp021397. [DOI] [PMC free article] [PubMed] [Google Scholar]
- Traub RD, Wong RK, Miles R, Michelson H. A model of a CA3 hippocampal pyramidal neuron incorporating voltage-clamp data on intrinsic conductances. Journal of Neurophysiology. 1991;66:635–650. doi: 10.1152/jn.1991.66.2.635. [DOI] [PubMed] [Google Scholar]
- Van Vreeswijk C, Abbott LF, Ermentrout GB. When inhibition not excitation synchronizes neural firing. Journal of Computational Neuroscience. 1994;1:313–321. doi: 10.1007/BF00961879. [DOI] [PubMed] [Google Scholar]
- Wang XJ, Buzsáki G. Gamma oscillation by synaptic inhibition in a hippocampal interneuronal network model. Journal of Neuroscience. 1996;16:6402–6413. doi: 10.1523/JNEUROSCI.16-20-06402.1996. [DOI] [PMC free article] [PubMed] [Google Scholar]
- Wang XJ, Rinzel J. Spindle rhythmicity in the reticularis thalami nucleus: synchronization among mutually inhibitory neurons. Neuroscience. 1993;53:899–904. doi: 10.1016/0306-4522(93)90474-t. [DOI] [PubMed] [Google Scholar]
- White JA, Banks MI, Pearce RA, Kopell NJ. Networks of interneurons with fast and slow gamma-aminobutyric acid type A (GABAA) kinetics provide substrate for mixed gamma-theta rhythm. Proceedings of National Academy of Sciences of the USA. 2000;97:8128–8133. doi: 10.1073/pnas.100124097. [DOI] [PMC free article] [PubMed] [Google Scholar]
- White JA, Chow CC, Ritt J, Soto-Treviño C, Kopell N. Synchronization and oscillatory dynamics in heterogeneous, mutually inhibited neurons. Journal of Computational Neuroscience. 1998;5:5–16. doi: 10.1023/a:1008841325921. [DOI] [PubMed] [Google Scholar]
- Ylinen A, Soltesz I, Bragin A, Penttonen M, Sik A, Buzsáki G. Intracellular correlates of hippocampal theta rhythm in identified pyramidal cells, granule cells, and basket cells. Hippocampus. 1995;5:78–90. doi: 10.1002/hipo.450050110. [DOI] [PubMed] [Google Scholar]
- Yuen GL, Durand D. Reconstruction of hippocampal granule cell electrophysiology by computer simulation. Neuroscience. 1991;41:411–423. doi: 10.1016/0306-4522(91)90337-n. [DOI] [PubMed] [Google Scholar]
- Zar JH. Biostatistical Analysis. NJ, USA: Prentice Hall; 1984. [Google Scholar]