

Abstract
Objective:
To assess agreement between established methods of estimating salt intake from spot urine collections and 24 h urinary Na (24hUNa) and then to develop a valid formula that can be used in the Iranian population to estimate salt intake from spot urine samples.
Design:
A validation study. Three spot urine samples were collected (fasting second-void morning; afternoon; evening) on the same day as a 24 h urine collection. We estimated 24hUNa from spot specimens using the Kawasaki, Tanaka and INTERSALT equations. Two new formulas were developed, the Iran formula 1 (Iran 1) and Iran formula 2 (Iran 2), based on our population characteristics.
Setting:
Iranian adults recruited in 2014–2015.
Participants:
Healthy volunteer adults aged ≥18 years.
Results:
With all three spot urine specimens, predicted population 24hUNa was underestimated based on the INTERSALT equation (−469 to −708 mg/d; all P < 0·05) and conversely overestimation occurred with the Kawasaki equation (926 to 1080 mg/d; all P < 0·01). The Tanaka equation produced comparable estimates to measured 24hUNa (–151 to 86 mg/d; all P > 0·49). The newly derived formulas, Iran 1 and Iran 2, showed less mean bias than the established equations (Iran 1: 43 to 80 mg/d, all P > 0·55; Iran 2: 22 to 90 mg/d, all P > 0·50).
Conclusions:
In this Iranian sample, the Tanaka equation and newly derived formulas produced group-level estimates comparable to measured 24hUNa. The newly developed formulas showed less mean bias than established equations; however, they need to be tested for generalization in a larger sample.
Keywords: Salt, Sodium, Spot urine, Validation, 24 h Urine collection, Diet, Urine
A 30 % reduction in salt intake by 2025 is one of the nine WHO and World Health Assembly global target goals. Salt reduction has also been identified as one of the most cost-effective strategies for preventing non-communicable diseases(1,2). In Isfahan, a city in the central part of Iran, salt intake assessed using 24 h urinary Na excretion (24hUNa) was more than twofold higher than the WHO’s recommendation for adults of 5 g/d(3). There are no national data on population salt intake in Iran using reliable and reproducible methods.
There are several methods for assessing Na intake, each having different strengths and limitations(4). Measurement of 24hUNa is considered the gold standard owing to its accuracy(5). However, because of high cost and participant burden, it is deemed cumbersome for repeated measurements in large-scale epidemiological studies. Some investigators suggest spot urine collections are less burdensome and can be used with different formulas to estimate population 24hUNa excretion(6–8). The Kawasaki and Tanaka equations were developed in Japanese populations(8,9) and the INTERSALT equation was designed in North American and European populations(10). No single formula is universally accepted and all have reported biases when assessed by Bland–Altman plots(11). In addition, there is no consensus on the timing of spot urine sample collection(6,11,12).
However, a meta-analysis of twenty-nine studies including 10 414 individuals from thirty-four countries showed that methods based on spot urine collections produced comparable estimates to 24hUNa for population assessment of salt intake(13). The SHAKE Technical Package for Salt Reduction acknowledges that 24hUNa is the most accurate method of assessing population salt intake, but states that if it is not possible to complete 24 h urine collections, the method based on spot urine samples may provide a reasonable estimate of mean population salt intake. The Pan American Health Organization Regional Expert Group recommends use of 24hUNa excretion to estimate salt intake(14).
Salt intake assessment is required for monitoring and evaluating salt reduction programmes worldwide(15). Furthermore, the Iranian salt reduction initiative would benefit greatly from simple and precise tools to monitor the programme(16). The objective of the current analyses was to assess agreement between established methods of estimating salt intake from spot urine collections and 24hUNa in an Iranian population and to develop a new formula for use in the Iranian population.
Materials and methods
Design and sampling
The present validation study was performed on healthy adult participants in 2014–2015. Individuals aged over 18 years were recruited from those referred to the Isfahan Cardiovascular Research Institute for a routine check-up or were invited from the general population. We enrolled them if they had no active or substantive chronic diseases. People with diabetes insipidus, renal insufficiency, a special dietary regimen, prolonged religious fasting (Muslim fasting) or menstruating on the day of sampling, using diuretics, using oral contraceptives or pregnant, or experiencing excessive sweating due to an unusually hot day or unusual physical activity day were excluded.
Three spot urine samples were obtained from fasting second-morning, afternoon and evening voids; all were collected as part of a 24 h urine collection.
As another of our objectives in the present study was validation of an FFQ for assessment of salt intake, the FFQ was completed twice, at the beginning of the study and after 1 year, to examine its reproducibility. Three spot samples were collected after 1 year at the end of the study. The FFQ was also undertaken to understand the sources of salt in the diet and discretionary salt use. The results of this part of the study will be presented in a separate paper(17).
The study was approved by Isfahan Cardiovascular Research Institute ethics committee. Written informed consent was obtained from all participants.
Data collection
Trained health professionals carried out detailed interviews at baseline to obtain information about participants’ socio-economic and demographic characteristics and smoking status. Physical activity was assessed using the International Physical Activity Questionnaire (IPAQ)(18). Physical activity was determined from IPAQ as a continuous variable (MET minutes per week, where MET is metabolic equivalent of task). MET minutes show the level of energy expenditure. We calculated this score by considering light physical activity equal to <3 MET, moderate physical activity equal to 3–6 MET and vigorous physical activity equal to >6 MET.
Anthropometric measurements
At the baseline visit, trained health professionals measured standing height without shoes and recorded it to the nearest 0·5 cm. Body weight was measured with the participants wearing light clothes, without shoes and recorded to the nearest 0·5 kg(19). BMI was calculated as weight divided by height squared (kg/m2). While the participants were standing, waist circumference was measured at a level midway between the lower rib margin and the iliac crest with a non-elastic measuring tape. Hip circumference was also measured at the point yielding the maximum circumference over the buttocks using a non-elastic measuring tape(19).
Validity of spot urine sample
Each participant was provided with two small containers for the collection of two spot urine samples. A large sterile plastic container was also provided for collection of the 24 h urine sample. The participants were asked to collect the 24 h urine sample from 07.00 hours on one day to 07.00 hours the next day. After excluding the first void on the first day, they collected the second fasting voiding of the first day to the first voiding of the next day into the large container. Spot urine samples were collected into the small containers in the afternoon (15.00–17.00 hours) and evening (19.00–22.00 hours). Participants delivered the two spot and 24 h urine samples to the laboratory of Isfahan Cardiovascular Research Institute, which is standardized with a National Reference Laboratory, in the morning (07.00–10.00 hours) following the completion of the 24 h urine collection. The participants arrived at the laboratory in a fasting state and completed the second-void morning spot urine collection. Since the afternoon and evening spot urine collections were part of the 24 h urine collection, the laboratory technician separated a 2 ml aliquot of these spot urine collections and added the remaining urine to the 24 h collection. In order to obtain the whole 24hUNa, we multiplied Na concentration by the volume in litres. Urinary Na, K and Cl– were measured by emission flame photometry, while creatinine (Cr) was measured using the Jaffe method (Technical SMA 12–60)(20) in all 24 h urine and spot samples. The following criteria were used to classify 24 h urine collections as incomplete: volume < 500 ml; recorded more than one missed void; collection of ≤20 h; 24 h urinary Cr (24hUCr) < 20 mg/dl per kg body weight and <15 mg/dl per kg body weight in males and females aged <50 years, respectively, and 24hUCr < 10 mg/dl per kg body weight and <7·5 mg/dl per kg body weight for males and females aged ≥50 years, respectively(21). One of our criteria for complete 24 h urine was ‘a recorded collection of ≥20 h for duration of urine collection’(22). Although our definition was 24 h urine collection, the time of collection in some of our participants was less than 24 h (20–23 h). Thus, we adjusted the volume of the measured 24 h urine sample for self-reported collection time as follows: (total volume collected/self-reported collection time) to reduce our error in prediction(22).
Estimation of 24 h sodium excretion from spot urine specimens
Estimation of 24hUNa excretion from spot urine Na (SUNa) concentrations was done using three equations: Kawasaki, Tanaka and INTERSALT (see online supplementary material, Supplemental Table S1). Predicted 24hUCr, which is used in the Kawasaki and Tanaka equations, was calculated using age, weight and height. Both the Kawasaki and INTERSALT equations have sex-specific prediction for 24hUNa.
Dietary assessment
Information on sources of salt in the diet was obtained using a validated FFQ(23). In the current study, we utilized only discretionary salt consumption from the FFQ in developing new equations, because the main source of salt intake (about 50 %) was derived from adding salt at the table and in cooking food(23). It was estimated by adding five questions to the FFQ regarding discretionary salt consumption including salt added at the table and during food preparation at home. The questions gathered information about the weight of salt packages that participants usually use in food preparation, how long the salt packages usually last, how often they are purchased, the total number of family members and their age to estimate salt consumption from salt packages by each participant(17).
Statistical analysis
We developed two new formulas for the prediction of 24hUNa using a hybrid learning algorithm based on artificial neural networks and particle swarm optimization. While fitting the output model to 24hUNa was performed using an artificial neural network, the input predictors were further selected using particle swarm optimization. Artificial neural networks have been successfully used in the literature for non-linear function approximations(24). One hidden layer and a root-mean-square-error cost function were used in the design of the artificial neural network and the Levenberg–Marquardt learning method, the combination of Gauss–Newton and the steepest descent methods, was used to tune its internal weights(25). Particle swarm optimization, a population-based stochastic optimization technique inspired by the social behaviour of bird flocking(26), was used to select the significant predictors during the modelling procedure(27). During the modelling procedure, we randomly assigned data points to two independent sets (set 1 and set 2). Half of the samples were randomly selected and used for algorithm development and the other half were used for validation. The first model was first fitted (i.e. tuned) on set 1 and the 24hUNa was predicted on set 2 using that model. Then, the second model was fitted (i.e. tuned) on set 2 and the 24hUNa was predicted on set 1 using that model. Whenever there is a plot containing data for the entire sample, the outputs of the first model on the second set and the second model on the first set are shown. Thus, we have plots for all the samples. Finally, these sets of urines were switched and modelling was repeated again to validate the model in the entire sample (hold-out validation framework)(28) (see online supplementary material, Supplemental Files S1 to S4).
We also noticed that the modelling mechanisms for high and low SUNa concentrations were different. Accordingly, if the examined SUNa concentration was less than or equal to 125·58 mmol/l, the formula Iran 1.a was used; for higher SUNa concentrations, the formula Iran 1.b was proposed.
The detection threshold was set empirically. The number of neurons for modelling with low and high SUNa concentrations was 10 and 15, respectively, showing that a more complex model was required for the high category. The algorithms were developed using a commercial software package (MATLAB 8.6; The Math Works Inc., Natick, MA, USA, 2015).
We calculated the mean and sd for measured 24hUNa and predicted 24hUNa using three established equations (INTERSALT, Tanaka and Kawasaki) and two new formulas (Iran 1 and Iran 2) with each of the three single spot urine collections (morning, afternoon, evening) for all participants. To assess agreement between the three established as well as the new formulas and 24hUNa, paired t tests with logarithmic transformations were conducted to examine the difference in measured and predicted 24hUNa values, and Spearman’s test and intraclass correlation coefficients (ICC) were used to evaluate the correlation between measured and predicted values of 24hUNa using established and new equations. The Bland–Altman analysis of agreement method was used to estimate the mean bias and 95 % limits of agreement between measured 24hUNa and estimates based on spot urine collections. For this method, the difference (predicted – measured) in 24 h urine excretion for each participant was plotted against the mean of the two methods. All statistical analyses were performed with the statistical software package IBM SPSS Statistics for Windows version 19.0. P values less than 0·05 were considered statistically significant.
Results
From a total of 198 participants at baseline, 113 remained in the study and attended at 1 year. We excluded participants from these analyses if their 24 h collection was assessed as incomplete, as follows: volume < 500 ml (n 17); recorded more than one void missed (n 2); collection time < 20 h (n 2); or 24hUCr excretion and spot urine outside the reference criteria (n 13). Data from seventy-nine participants were included in the analyses. The baseline demographic, clinical and biochemical characteristics of the participants are shown in Table 1. The mean age of participants was 40 (sd 11) years and men constituted 46·8 % of all participants.
Table 1.
Basic, clinical and biochemical characteristics of the participants: healthy volunteer Iranian adults aged ≥18 years (n 79), Isfahan Salt Study, 2014–2015
| Characteristic | Mean or n | % or sd |
|---|---|---|
| Age (years) | 40 | 11 |
| Sex (male) | 37 | 46·8 |
| Weight (kg) | 72 | 15 |
| Height (cm) | 165 | 10 |
| BMI (kg/m2) | 266 | 4 |
| Waist circumference (cm) | 91 | 12 |
| Hip circumference (cm) | 91 | 11 |
| Waist-to-hip ratio | 1 | 0·1 |
| Systolic blood pressure (mmHg) | 116 | 11 |
| Diastolic blood pressure (mmHg) | 72 | 9 |
| 24 h Urinary Na excretion (mmol/l) | 162 | 79 |
| 24 h Urinary K excretion (mmol/l) | 113 | 33 |
| 24 h Urinary creatinine excretion (mmol/l) | 1250 | 648 |
| Morning urinary Na excretion (mmol/l) | 147 | 52 |
| Morning urinary K excretion (mmol/l) | 84 | 42 |
| Morning urinary creatinine excretion (mmol/l) | 169 | 91 |
| Afternoon urinary Na excretion (mmol/l) | 153 | 58 |
| Afternoon urinary K excretion (mmol/l) | 72 | 45 |
| Afternoon urinary creatinine excretion (mmol/l) | 150 | 57 |
| Evening urinary Na excretion (mmol/l) | 169 | 61 |
| Evening urinary K excretion (mmol/l) | 67 | 39 |
| Evening urinary creatinine excretion (mmol/l) | 148 | 67 |
| 24 h Urinary volume (ml/d) | 1528 | 457 |
Data are presented as mean and sd except for Sex (male), which is presented as n and %.
Our proposed spot formula
As predicted 24hUNa using the three previous equations (Tanaka, Kawasaki and INTERSALT) had high mean bias against measured 24hUNa, we developed new formulas based on our population characteristics. In our Iran formula 1 (Iran 1), in addition to Na, K and Cr spot values, demographic variables were included in the model. The selected predictors for both low and high Na categories were: sex; age; BMI; waist-to-hip ratio; spot urine concentration of Na, K and Cr; spot urine acquisition time (1 = morning, 2 = afternoon, 3 = evening); and physical activity, while the output of the model was predicted 24hUNa.
Our proposed spot formula with discretionary salt
In addition to Na, K and Cr spot values, demographic variables and discretionary salt intake (mg/d) were also assessed in the model to derive the Iran formula 2 (Iran 2). The selected predictors for both low and high Na categories were: sex; age; BMI; waist-to-hip ratio; spot concentration of Na, K and Cr; spot urine acquisition time (1 = morning, 2 = afternoon, 3 = evening); physical activity (in MET); and discretionary salt intake (in mg/d), while the output of the model was predicted 24hUNa. We chose discretionary salt because it can be estimated with five questions and thus is easier than estimating total salt intake.
Estimation of 24 h sodium excretion from spot urine specimens
With all three spot urine specimens, predicted population 24hUNa was significantly overestimated based on Kawasaki equation (926 to 1080 mg/d; all P < 0·01) and significantly underestimated using the INTERSALT equation (−469 to −708 mg/d; all P < 0·05).
However, the estimated 24hUNa values based on the Tanaka equation (–151 to 86 mg/d; all P > 0·49) and our proposed two new formulas were not significantly different from the measured level at all spot urine collection time points (Iran 1: 43 to 80 mg/d, all P > 0·55; Iran 2: 22 to 90 mg/d, all P > 0·50; Table 2). Also, Table 2 shows the Spearman correlation coefficients (ρ) and ICC between measured 24hUNa and estimated values based on all equations. Among established formulas, the ICC between measured 24hUNa and estimated values based on Tanaka and Kawasaki equations using evening specimens were the highest (Tanaka: 0·33, P = 0·002; Kawasaki: 0·36, P = 0·001). The highest Spearman correlation and ICC values were observed with the Iran 2 formula applied to spot urine samples collected in the evening (ρ = 0·79 and ICC = 0·78; P < 0·001).
Table 2.
Mean of measured and predicted 24 h urinary sodium excretion (24hUNa) among healthy volunteer Iranian adults aged ≥18 years (n 79), Isfahan Salt Study, 2014–2015
| 24hUNa (mg/24 h) | P value* | Correlation coefficients | |||||
|---|---|---|---|---|---|---|---|
| Mean | sd | ρ † | P value | ICC‡ | P value | ||
| Measured | 3733 | 1816 | – | – | – | – | – |
| INTERSALT equation | |||||||
| Morning | 3025 | 858 | 0·001 | 0·20 | 0·08 | 0·17 | 0·2 |
| Afternoon | 3098 | 882 | 0·003 | 0·29 | 0·009 | 0·22 | 0·06 |
| Evening | 3264 | 907 | 0·024 | 0·31 | 0·006 | 0·30 | 0·06 |
| Tanaka equation | |||||||
| Morning | 3582 | 1282 | 0·55 | 0·11 | 0·31 | 0·16 | 0·22 |
| Afternoon | 3594 | 852 | 0·49 | 0·39 | <0·001 | 0·21 | 0·08 |
| Evening | 3819 | 965 | 0·65 | 0·41 | <0·001 | 0·33 | 0·002 |
| Kawasaki equation | |||||||
| Morning | 4772 | 2346 | 0·005 | 0·15 | 0·19 | 0·18 | 0·19 |
| Afternoon | 4659 | 1314 | <0·001 | 0·38 | <0·001 | 0·29 | 0·005 |
| Evening | 4813 | 1589 | <0·001 | 0·39 | <0·001 | 0·36 | 0·001 |
| Iran 1 formula | |||||||
| Morning | 3776 | 1432 | 0·789 | 0·65 | <0·001 | 0·64 | <0·001 |
| Afternoon | 3794 | 1521 | 0·667 | 0·73 | <0·001 | 0·72 | <0·001 |
| Evening | 3813 | 1595 | 0·556 | 0·76 | <0·001 | 0·75 | <0·001 |
| Iran 2 formula | |||||||
| Morning | 3823 | 1413 | 0·503 | 0·76 | <0·001 | 0·73 | <0·001 |
| Afternoon | 3755 | 1633 | 0·878 | 0·74 | <0·001 | 0·73 | <0·001 |
| Evening | 3763 | 1652 | 0·816 | 0·79 | <0·001 | 0·78 | <0·001 |
Comparison between mean of measured v. predicted 24hUNa by paired Student t test.
ρ, Spearman’s correlation coefficient.
ICC, intraclass correlation coefficient.
The Bland–Altman plots are presented in Figs 1–5. The highest mean bias was observed with the estimations based on the Kawasaki equation at all time points. Proportional bias was present for the Tanaka and INTERSALT equations such that 24hUNa was overestimated at lower levels of excretion and underestimated at higher (Figs 1 and 2). However, our two proposed formulas showed less over- and underestimation (Figs 4 and 5).
Fig. 1.
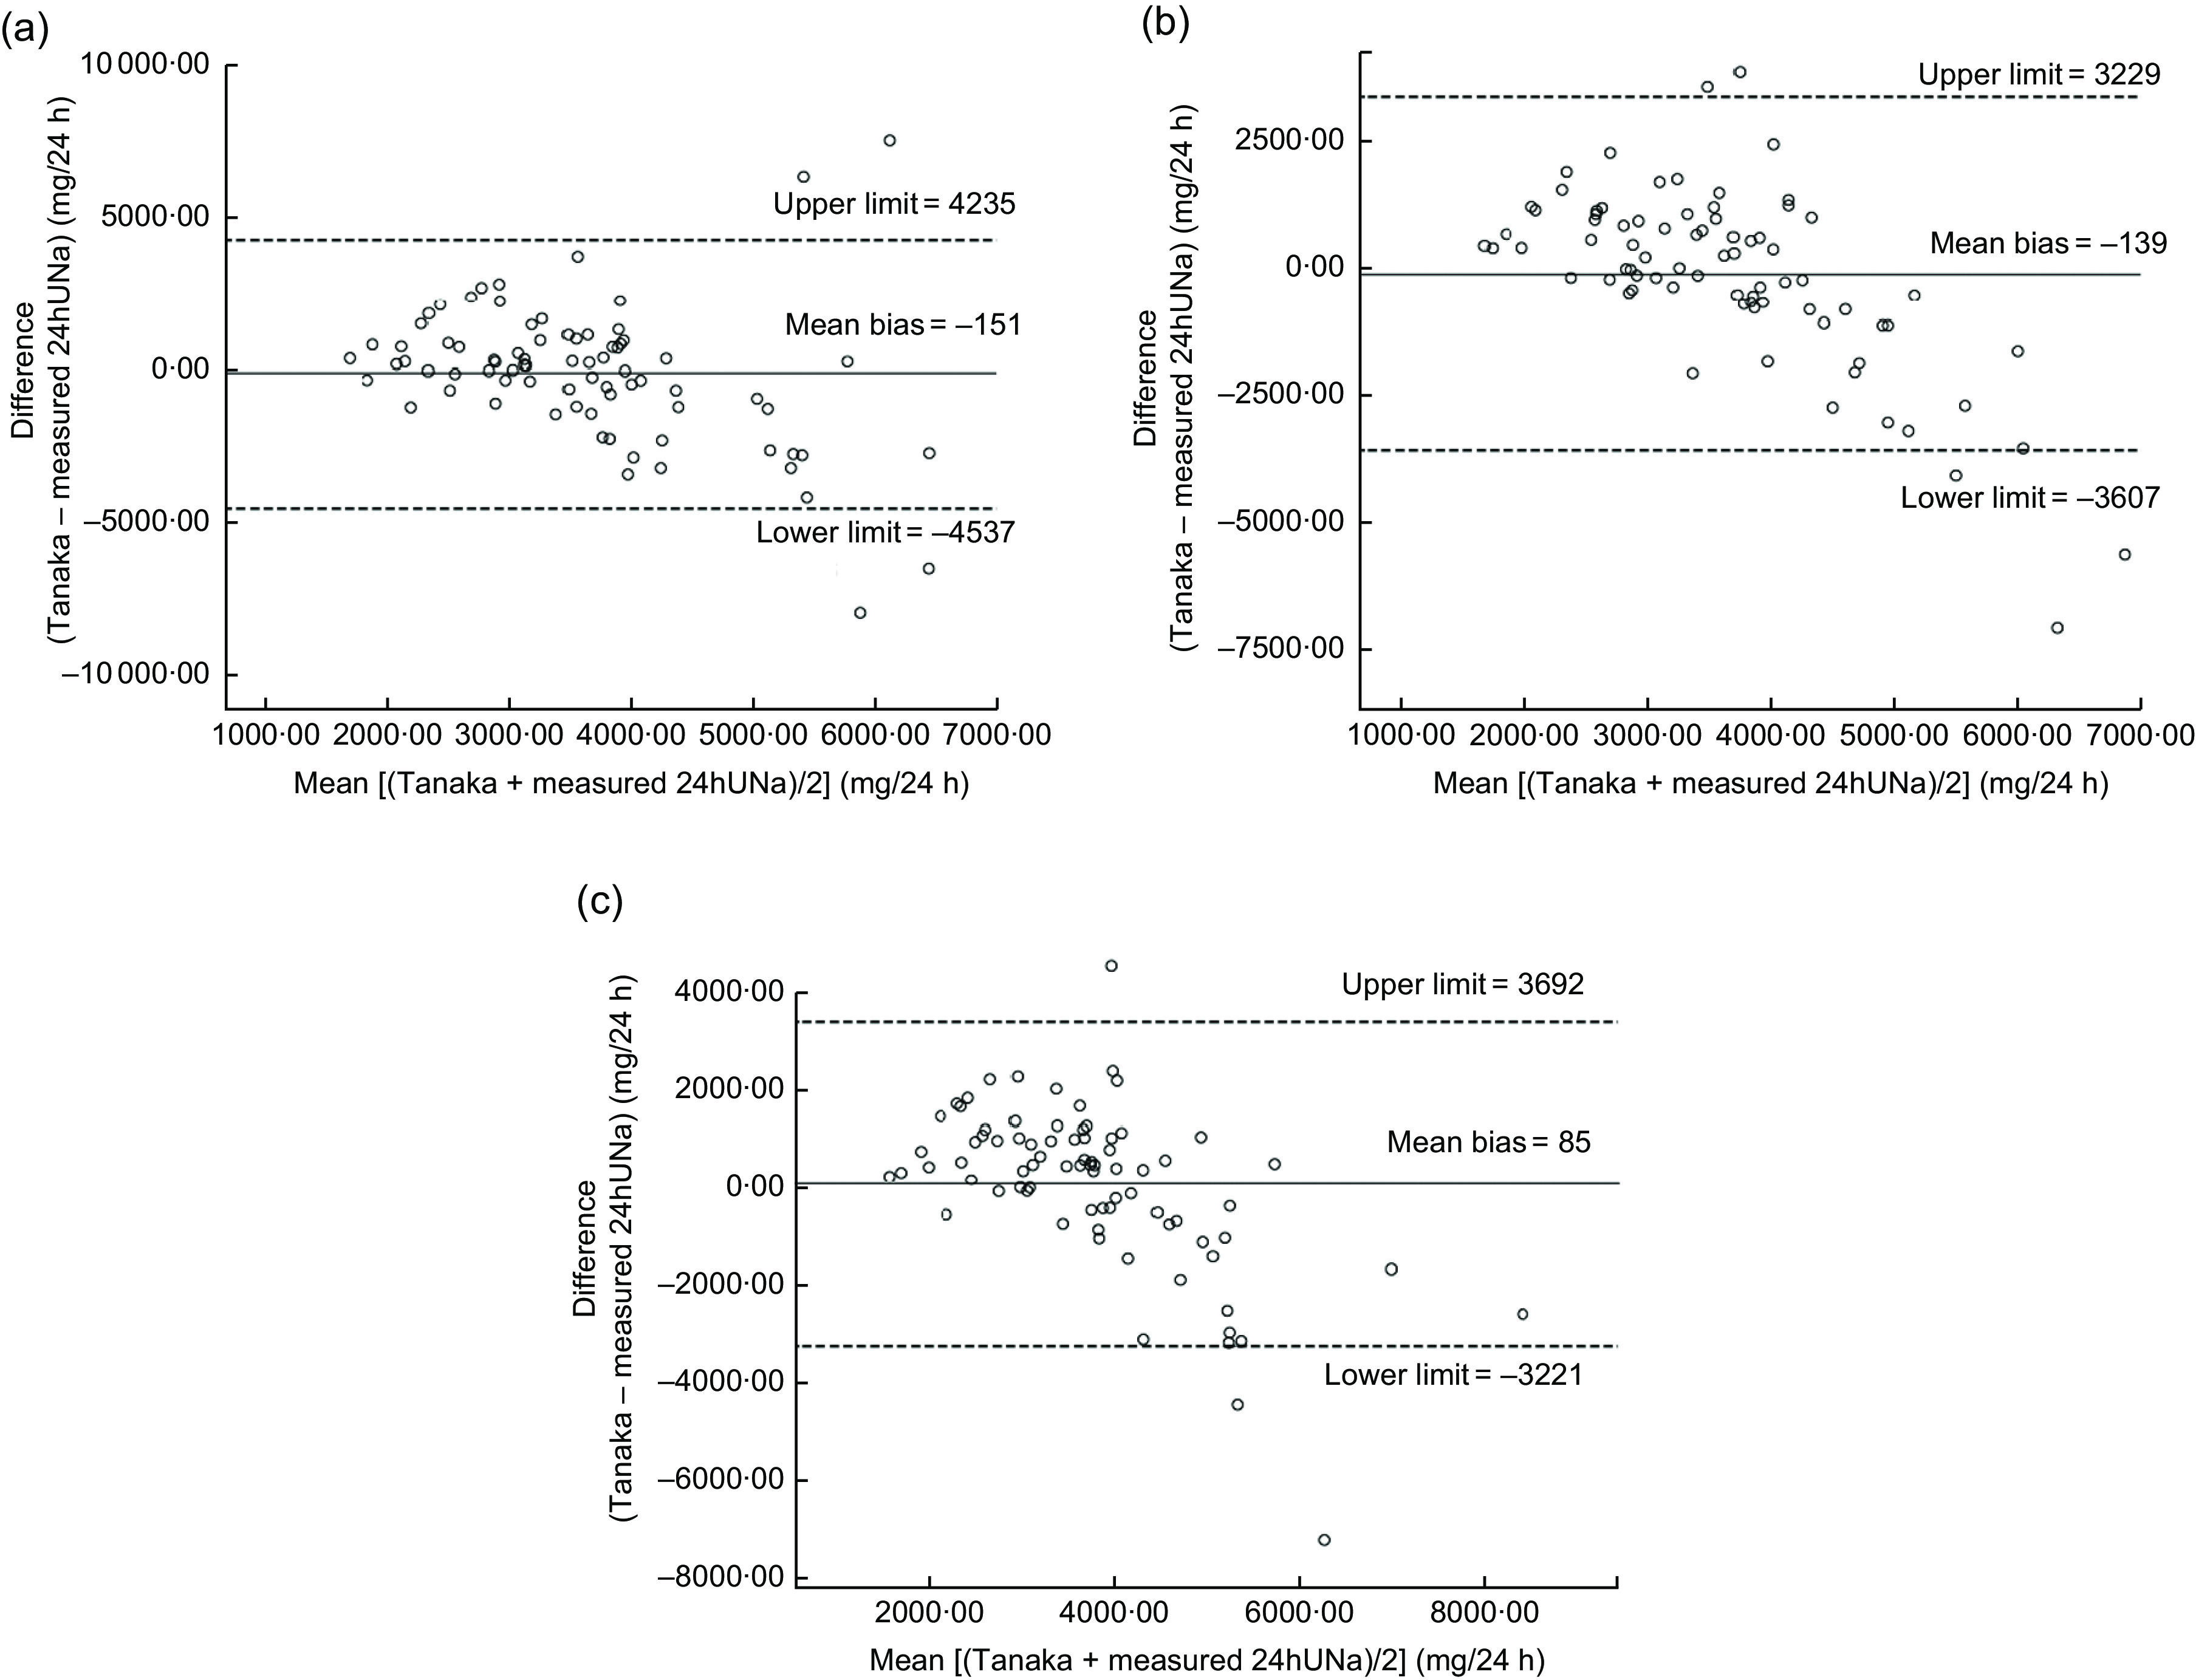
Bland–Altman plots of the mean bias (difference in agreement) between predicted 24 h urinary sodium excretion (24hUNa) based on the Tanaka equation and measured 24hUNa from spot urine samples collected in the morning (a), afternoon (b) and evening (c) among healthy volunteer Iranian adults aged ≥18 years (n 79), Isfahan Salt Study, 2014–2015. The mean bias for each individual is the predicted minus the measured 24hUNa and is plotted v. the mean of the predicted and measured 24hUNa.  , mean bias;
  , 95 % limits of agreement
Fig. 5.
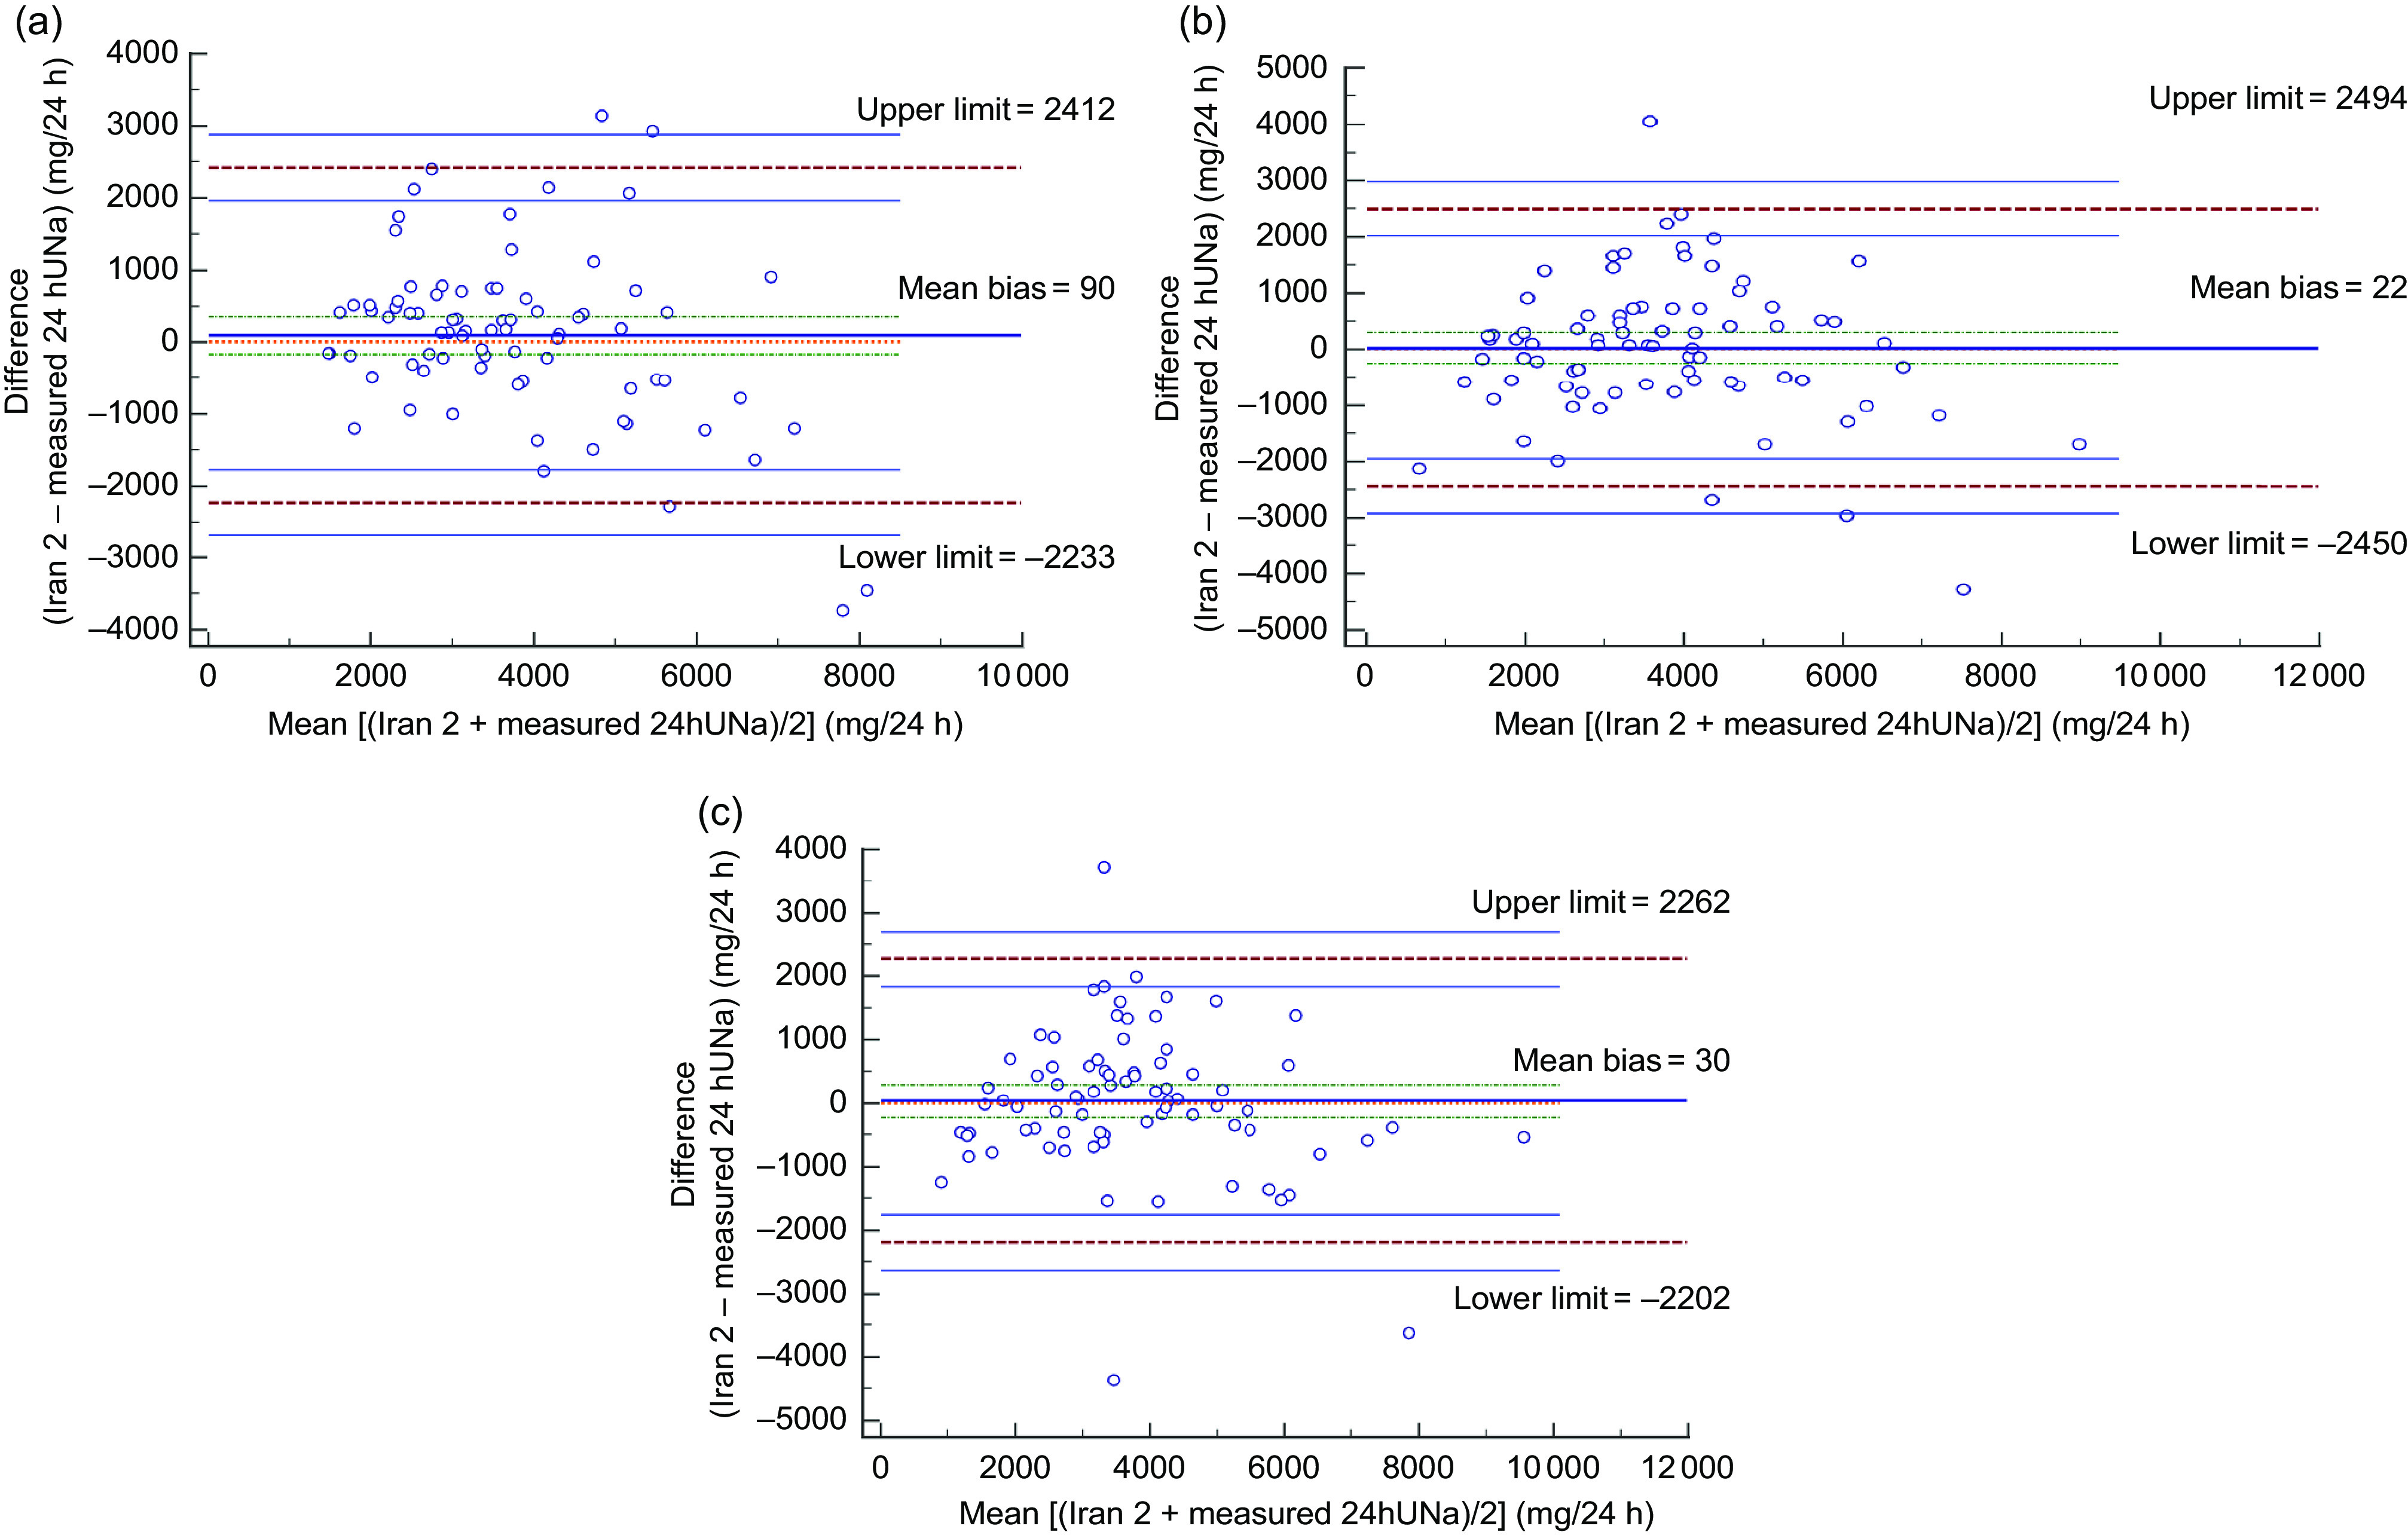
Bland–Altman plots of the mean bias (difference in agreement) between predicted 24 h urinary sodium excretion (24hUNa) based on the Iran formula 2 (Iran 2) and measured 24hUNa from spot urine samples collected in the morning (a), afternoon (b) and evening (c) among healthy volunteer Iranian adults aged ≥18 years (n 79), Isfahan Salt Study, 2014–2015. The mean bias for each individual is the predicted minus measured 24hUNa and is plotted v. the mean of the predicted and measured 24hUNa. Data points were assigned to two independent sets (set 1 and set 2). The first model was first fitted (i.e. tuned) on set 1 and the 24hUNa was predicted on set 2 using that model. The second model was fitted (i.e. tuned) on set 2 and the 24hUNa was predicted on set 1 using that model. Whenever there is a plot on the entire sample, the outputs of the first model on the second set and the second model on the first set are shown. Thus, we have plots for all the samples.  , line of equality;
  , mean bias;
  , 95 % CI of the mean bias;
  , lower and upper limits of agreement (mean difference ± 1·96 sd of the difference);
  , 95 % CI of the limits of agreement
Fig. 2.

Bland–Altman plots of the mean bias (difference in agreement) between predicted 24 h urinary sodium excretion (24hUNa) based on the INTERSALT equation and measured 24hUNa from spot urine samples collected in the morning (a), afternoon (b) and evening (c) among healthy volunteer Iranian adults aged ≥18 years (n 79), Isfahan Salt Study, 2014–2015. The mean bias for each individual is the predicted minus the measured 24hUNa and is plotted v. the mean of the predicted and measured 24hUNa.  , mean bias;
  , 95 % limits of agreement
Fig. 4.

Bland–Altman plots of the mean bias (difference in agreement) between predicted 24 h urinary sodium excretion (24hUNa) based on the Iran formula 1 (Iran 1) and measured 24hUNa from spot urine samples collected in the morning (a), afternoon (b) and evening (c) among healthy volunteer Iranian adults aged ≥18 years (n 79), Isfahan Salt Study, 2014–2015. The mean bias for each individual is the predicted minus measured 24hUNa and is plotted v. the mean of the predicted and measured 24hUNa. Data points were assigned to two independent sets (set 1 and set 2). The first model was first fitted (i.e. tuned) on set 1 and the 24hUNa was predicted on set 2 using that model. The second model was fitted (i.e. tuned) on set 2 and the 24hUNa was predicted on set 1 using that model. Whenever there is a plot on the entire sample, the outputs of the first model on the second set and the second model on the first set are shown. Thus, we have plots for all the samples.  , line of equality;
  , mean bias;
  , 95 % CI of the mean bias;
  , lower and upper limits of agreement (mean difference ± 1·96 sd of the difference);
  , 95 % CI of the limits of agreement
Fig. 3.
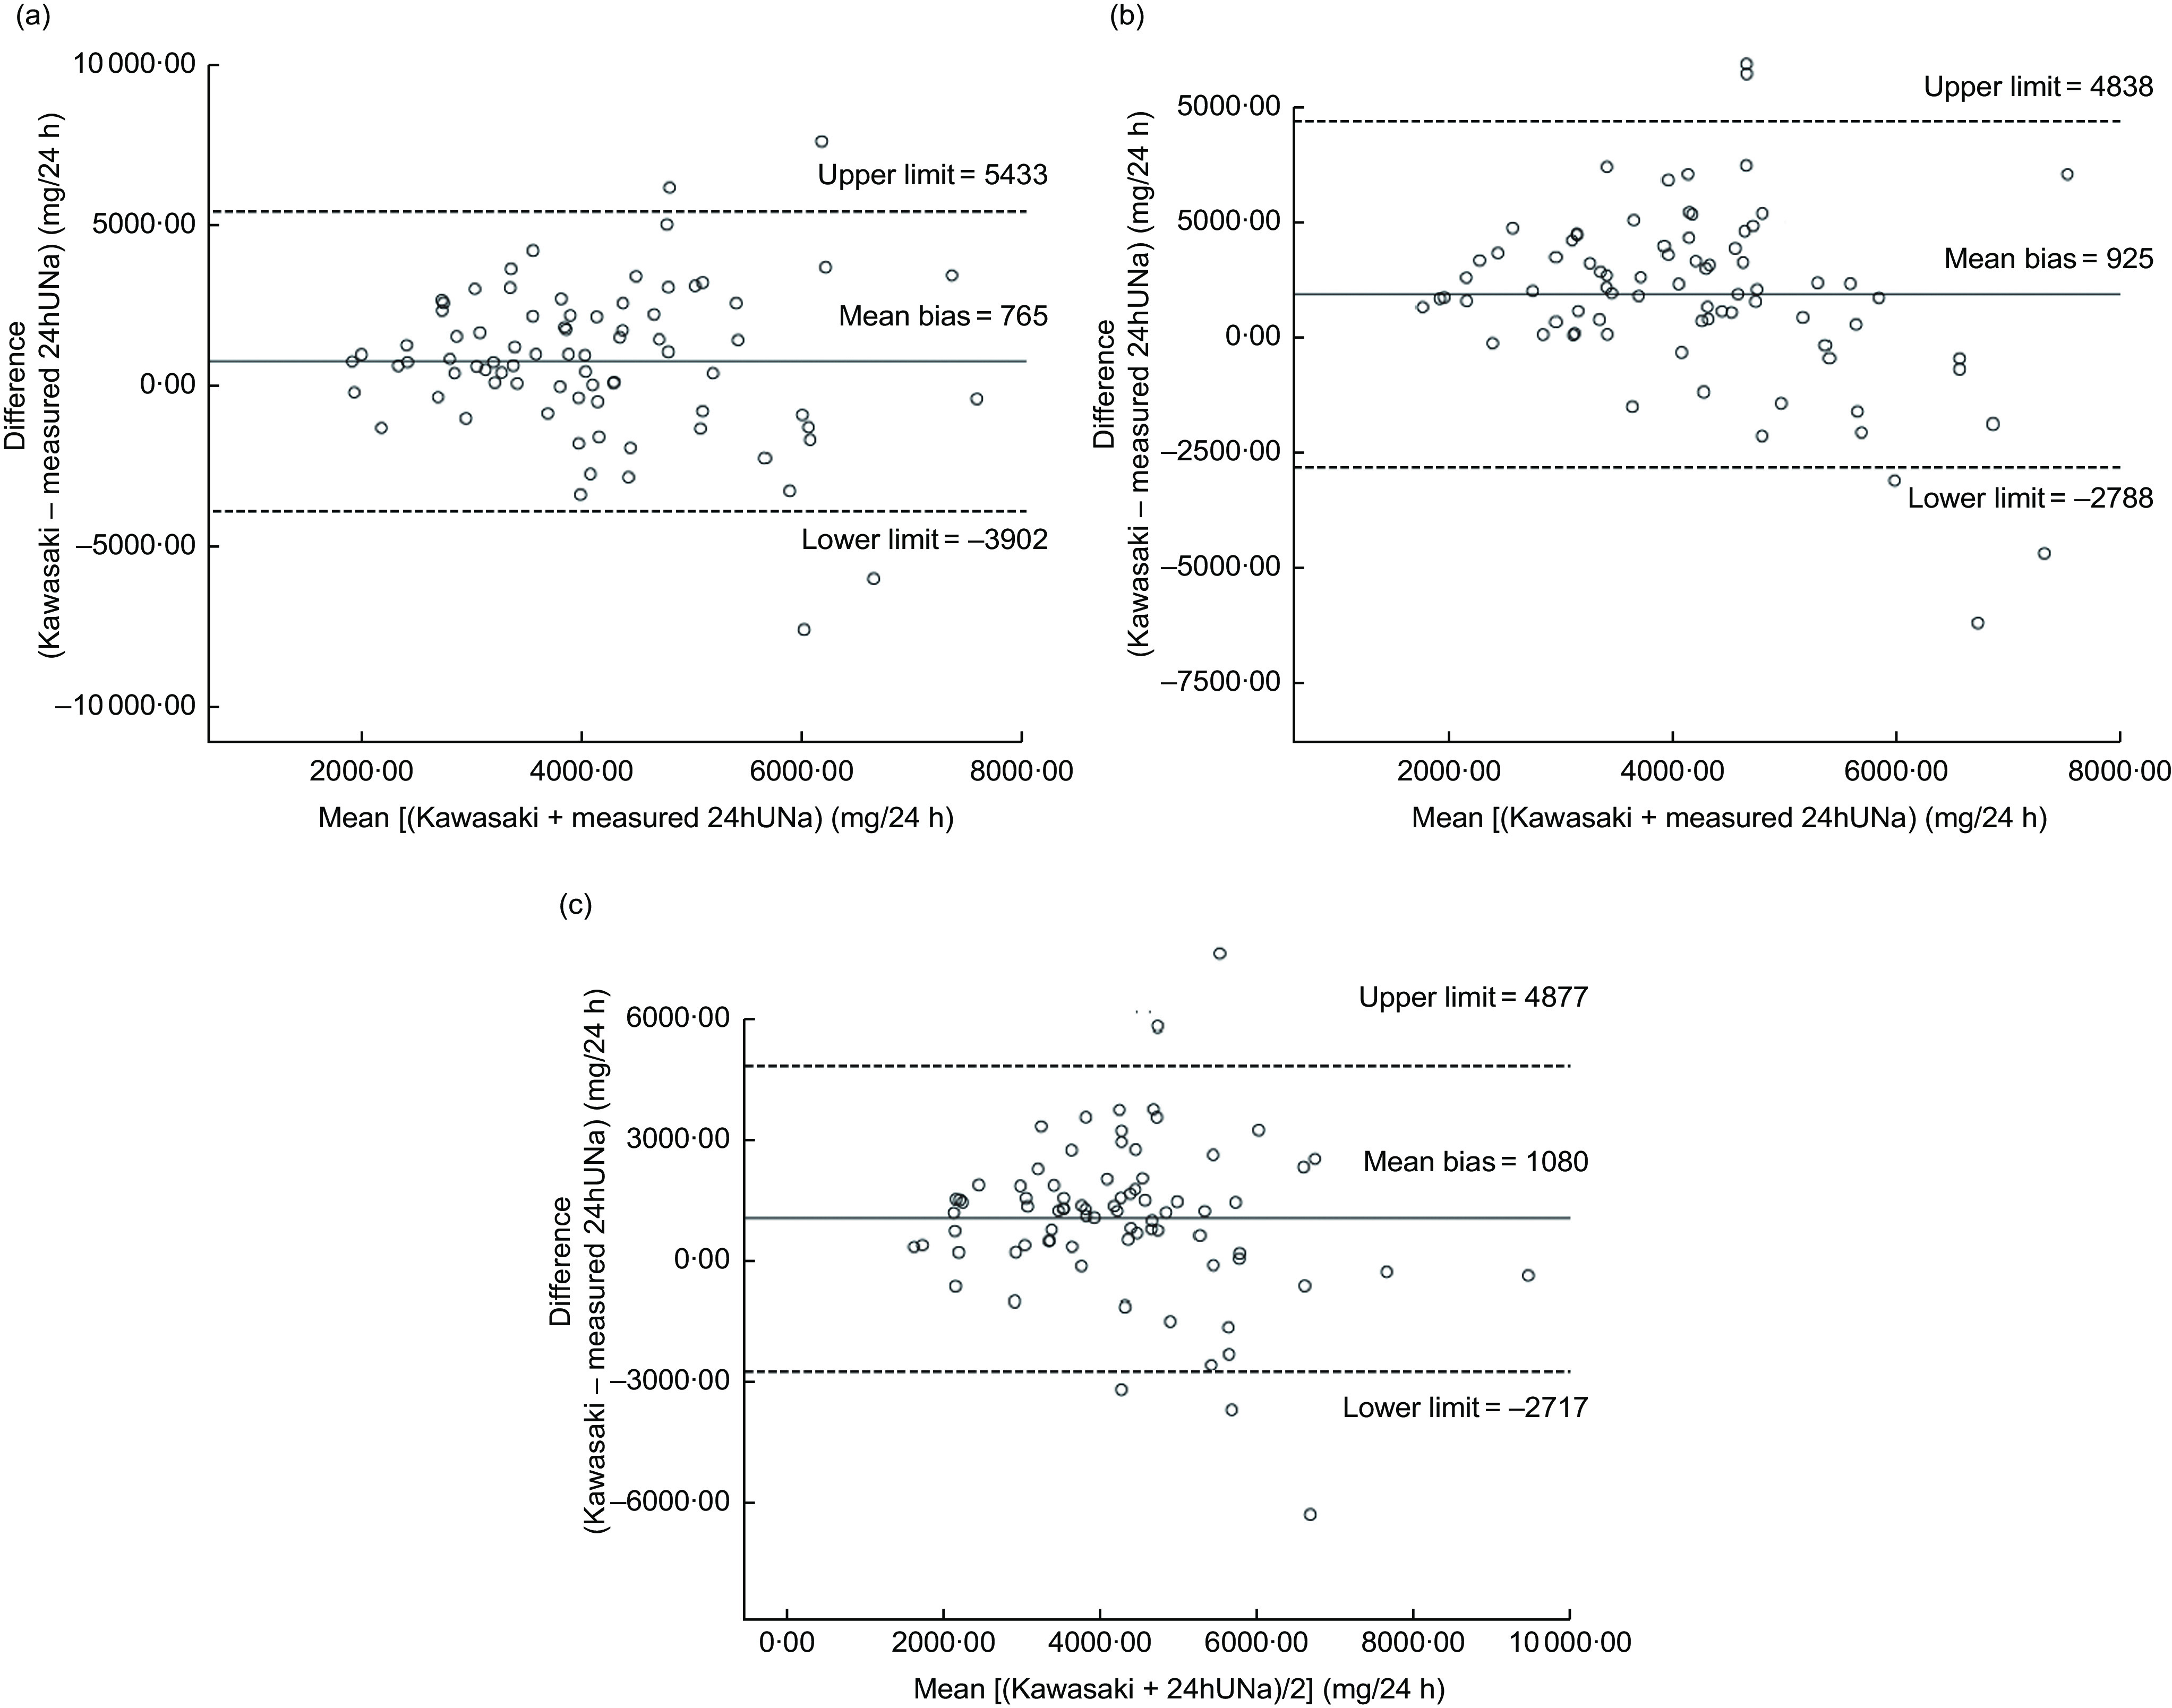
Bland–Altman plots of the mean bias (difference in agreement) between predicted 24 h urinary sodium excretion (24hUNa) based on the Kawasaki equation and measured 24hUNa from spot urine samples collected in the morning (a), afternoon (b) and evening (c) among healthy volunteer Iranian adults aged ≥18 years (n 79), Isfahan Salt Study, 2014–2015. The mean bias for each individual is the predicted minus measured 24hUNa and is plotted v. the mean of the predicted and measured 24hUNa.  , mean bias;
  , 95 % limits of agreement
Formula Iran 2 (Supplemental Files S3 and S4) is more complex than Iran 1 (Supplemental Files S1 and S2) in terms of the number of required predictors and arithmetic calculations. The Iran 2 formula as a more complex model had a greater correlation with 24hUNa (Table 2) and less mean and variance biases, particularly for the evening and afternoon spot samples (Figs 4 and 5). In the afternoon spot samples, the mean bias of Iran 1 and Iran 2 was 61 and 22 mg/d, respectively (Fig. 4(b) and Fig. 5(b)). Moreover, there was level-dependent bias (i.e. spot low (SUNa ≤ 125·58 mmol/l) and spot high) in our formulas. For example, the absolute overall bias of the predicted 24 h Na intake was 51·37 and 10·65 mg/d, respectively, for Iran 1.a (spot low) and Iran 2.b (spot high) formulas.
Discussion
The current study was carried out to determine if average population daily Na intake could be assessed using established equations based on a single spot urine sample and to develop new formulas for this estimation based on the characteristics of Iranian individuals. One of these newly developed formulas includes estimated discretionary salt intake in addition to SUNa concentration to develop an equation which predicted 24hUNa with less mean bias.
Based on the Kawasaki and INTERSALT equations, the mean levels of 24hUNa were significantly overestimated and underestimated compared with measured 24hUNa for all spot urine collection time points, respectively. However, the estimates based on the Tanaka equation were not significantly different from the measured 24hUNa. Using our new developed formulas Iran 1 and Iran 2, the estimates of 24hUNa were very similar to measured values at all three time points of spot urine collection (Iran 1: 43 to 80 mg/d; Iran 2: 22 to 90 mg/d). These mean bias values were relatively less than for all other equations when applied to our population and also other populations. In our study, Bland–Altman plots were used to identify the bias values of different methods within the entire range of target values. The conventional limits of maximum acceptable differences, i.e. ±1·96 sd of the difference, were used as expected agreements(29). Since the entire methods exceeded such thresholds, none of the methods are completely reliable. However, following the interpretation of ICC values, Iran 1 and Iran 2 formulas showed good validity (ICC between 0·75 and 0·78) when evening spot urines were used and moderate validity (ICC between 0·64 and 0·73) otherwise. Moreover, the other equations showed poor validity (ICC less than 0·50).
In our study, we observed a weak correlation between estimated 24hUNa based on established equations and measured 24hUNa excretion, which was similar to or lower than in previous studies(6,8,10,30–33). Consistent with our study, a recent systematic review of more than 1·3 million adults and children(14) and several studies from South Africa, the UK, Italy and Denmark(11,33,34) have shown that the correlation between measured and estimated 24hUNa using the Tanaka equation is weak. In a Korean population, the correlation coefficient between measured and estimated daily Na excretion by Kawasaki, Tanaka and INTERSALT equations was relatively high, although there were significant differences between the spot urine-based estimation methods and measured 24hUNa(7). The correlation coefficients between the estimated and measured 24hUNa in Tanaka’s study was 0·54, based on random urine collection(8). In Kawasaki’s study, the correlation coefficient between measured and estimated 24hUNa from second morning voids was 0·73 in a Japanese population(9). It is likely that the estimation based on Kawasaki equation works better in populations that it was developed in(32).
We further predicted the 24hUNa using multiple linear regression, based on the same predictors as proposed in the Iran 1 and Iran 2 formulas by the particle swarm optimization algorithm. Based on the predictors of the Iran 1 formula, significant Spearman correlation coefficients between the predicted and measured 24hUNa were found: ρ = 0·267, 0·418 and 0·458. They slightly increased when the predictors of the Iran 2 formula were used: ρ = 0·274, 0·422 and 0·459, for morning, afternoon and evening, respectively. Although the performance of multiple linear regression with the features selected by particle swarm optimization was better than that of the INTERSALT, Tanaka and Kawasaki equations, the proposed Iran 1 and Iran 2 formulas outperformed the entire methods including multiple linear regression. This shows that not only the predictor selection algorithm is important, but also it is necessary to use a proper method that can deal with the non-linearity of the data (artificial neural network v. multiple linear regression).
In line with our result, the studies by Mann and Gerber(6) and Cogswell et al.(22) revealed that evening spot urine was the most reliable. Those studies concluded that estimation by the Tanaka and INTERSALT equations, especially based on afternoon and evening urine samples, were closer to observed levels, although the Kawasaki equation had the greatest bias. Similarly, among American young adults the predictions of the INTERSALT equation based on afternoon and evening spot samples were close to measured values and the Tanaka equation had better approximation than the Kawasaki equation(22).
In our study, the mean differences between measured and predicted values based on Tanaka, Kawasaki and INTERSALT equations were greater than in most previous reports(11,35). These studies showed inconsistent levels of under- and overestimation using these formulas(11,35); for example, overestimation in the presence of low level of Na excretion and underestimation in high level of daily Na excretion(22). We found greater limits of agreement (95 % CI) than Brown et al.’s and Rhee et al.’s studies for all equations, but the greatest was for the Kawasaki equation(7,10). Thus, in our study the variation at the individual level is high and spot urine samples could not be used to estimate salt intake for individuals. Rhee et al. developed equations estimating 24hUNa from first-morning spot urine samples including linear, quadratic and cubic models among 101 participants. The limits of agreement between measured and estimated 24hUNa by the developed equations exceeded 2300 mg/24 h in the Bland–Altman analysis(7). Among 2745 participants in the INTERSALT study, Brown et al. developed an equation to estimate 24hUNa from casual urine Na, K and Cr levels and age, age2, region and BMI. The mean bias of predicted and measured 24hUNa was −37 and 53 mg/d in men and women, respectively(10). The Prospective Urban Rural Epidemiological (PURE) study examined predicted 24hUNa from a single morning fasting spot urine using Kawasaki, Tanaka and INTERSALT equations among 448 healthy individuals aged 35–70 years from eleven countries. Mente at al. suggested that predicted 24hUNa excretion using the Kawasaki equation was a reliable method for estimating 24hUNa in their population. Similar to our findings, the Kawasaki equation overestimated 24hUNa (mean bias: +313 mg/d; 95 % CI +182, +444 mg/d); however, the INTERSALT (−872 mg/d; 95 % CI −728, −1016 mg/d) and Tanaka (−548 mg/d; 95 % CI −408, −688 mg/d) equations underestimated 24hUNa (P < 0·001 and P = 0·02, respectively)(36). However, the PURE study had a number of significant limitations(37). The main limitation of the PURE study was under- or overestimation of the predicted values v. the observed levels among their participants in high or low level of Na excretion, respectively(36). In addition, the PURE study had an exceptionally high rate of incomplete 24 h urines, estimated at 70 %, when appropriate methods for assessing completeness were used(32). Using the first void (overnight) urine specimen instead of the second morning fasting urine as in the original study(32) may have resulted in a falsely high correlation, because overnight urine samples represented a high proportion of the 24 h urine samples, especially in the incomplete urine collections(37). Thus, it has been concluded that the equations developed based on characteristics of Asian populations who consume higher Na could not be utilized in a Western or other population with lower Na intake(22). Moreover, metabolic studies have suggested that greater Na excretion occurs in the afternoon and evening, and less excretion occurs between midnight and early morning, among healthy individuals(38,39); thus it is suggested that the urine excretion in the midpoint of urine collection may be closer to the whole day. In summary, there is limited agreement in the literature on the optimal timing of spot urine collection and what equation should be used in specific populations.
Hence, according to the WHO global target of a 30 % reduction in salt intake by 2025 and the necessity of national salt intake assessment, it is likely that developing an equation based on the characteristics of the population of interest may result in more reliable estimations of 24hUNa. In the current study we developed new formulas with less bias for use in the Iranian population.
In our models, we utilized Na, K and Cr spot values, sex, age, BMI, waist-to-hip ratio and spot urine acquisition time (1 = morning, 2 = afternoon, 3 = evening) and the Iran 2 formula included discretionary salt in addition to the aforementioned variables. The arithmetic formulas derived were different based on the Na concentration of the spot urine sample (low: ≤125·58 mmol/l; high: >125·58 mmol/l). Estimation of 24hUNa by applying the Iran 1 and Iran 2 formulas to afternoon spot urines resulted in the least bias; mean bias was 61 and 22 mg/d for Na excretion, equal to 0·1 and 0·05 g/d for salt intake, with Iran 1 and Iran 2, respectively. The accuracy of our new formula was better and had the least of bias in estimating Na intake.
Consistent with our study, the cubic equation developed by Rhee et al. in the Korean population indicated low mean bias of 21 mg between measured and estimated values(7). Moreover, prediction of 24hUNa from spot urine collections in Denmark using a Danish equation(33) and also in Korea by models including linear, quadratic and cubic(7) provided better estimates of 24hUNa than previous formulas. In contrast, the equation developed by Ji et al. in British and Italian populations using an arithmetic extrapolation model illustrated bias, with overestimate for low and underestimate for high salt intake through Bland–Altman plots(34).
Strengths and limitations
One of the main strengths of our study is that spot urine samples were collected in the morning, afternoon and evening to enable the assessment of differences based on the timing of collection. In addition, the spot urine collections were done on the same day as the 24 h urine collection. We included only those participants who had complete 24 h urine collections according to Cr excretion criteria, urine volume and reported collection times. Our study population was healthy and individuals with any disorder that may interfere with Na excretion were excluded. However, the main limitation was the relatively small number of participants. As the spot urine was collected as part of a 24 h urine collection, the correlation coefficients may have been falsely inflated. We relied on a single 24 h urine collection for each participant. We did not corroborate the completeness of the 24 h urine collections using the p-aminobenzoic acid method(40) and recognize that the current formula for assessing the completeness of 24 h urines has limited accuracy and specifically does not account for population variations in muscle mass that will affect creatinine excretion(41).
Conclusions
Our newly developed formulas provide more reliable estimates of 24hUNa than the Tanaka, Kawasaki and INTERSALT equations. Thus, the estimations based on both of our developed formulas, especially Iran 2, provide a valid tool which give an acceptable estimation of the ‘true’ mean salt intake with low bias in this sample. Methods based on spot urine collections may provide reasonable estimates of group-level mean 24hUNa; however, similar to many previous studies, our findings show that it cannot be used to estimate 24hUNa for individuals. These formulas need to be tested on a larger population of Iranians with a larger range in salt intake.
Acknowledgements
Acknowledgements: This study was conducted by the Cardiovascular Research Institute, Isfahan University of Medical Sciences and was supported by the Department of Nutrition, the Ministry of Health and Medical Education in Iran. Financial support: This research received no specific grant from any funding agency in the public, commercial or not-for-profit sectors. Conflict of interest: N.R.C.C. is a paid consultant to the Novartis Foundation to support its programme to improve hypertension control in low- and middle-income countries which includes travel support for site visits and a contract to develop a survey. N.R.C.C. has provided paid consultative advice on accurate blood pressure assessment to Midway Corporation and is an unpaid member of World Action on Salt and Health (WASH). J.W. is Director of the WHO Collaborating Centre on Population Salt Reduction. Other authors report no conflict of interest. Authorship: N.M., N.S., Z.A., N.R.C.C., J.W. and K.P. designed the research; N.M. and A.K. conducted the research; N.M., M.M. and H.M. analysed the data; and N.M. wrote the paper. All authors read and approved the final manuscript. Ethics of human subject participation: This study was conducted according to the guidelines laid down in the Declaration of Helsinki and all procedures involving research study participants were approved by the Isfahan Cardiovascular Research Institute ethics committee. Written informed consent was obtained from all participants.
Supplementary material
For supplementary material accompanying this paper visit https://doi.org/10.1017/S136898001900257X.
click here to view supplementary material
References
- 1.Trieu K, Neal B, Hawkes C et al. (2015) Salt reduction initiatives around the world – a systematic review of progress towards the global target. PLoS One 10, e0130247. [DOI] [PMC free article] [PubMed] [Google Scholar]
- 2.Sarrafzadegan N & Gotay C (2015) CVD prevention in 2014: advances in the prevention of cardiovascular disease. Nat Rev Cardiol 12, 71–73. [DOI] [PubMed] [Google Scholar]
- 3.Khosravi A, Kelishadi R, Sarrafzadegan N et al. (2012) Impact of a community-based lifestyle intervention program on blood pressure and salt intake of normotensive adult population in a developing country. J Res Med Sci 17, 235–241. [PMC free article] [PubMed] [Google Scholar]
- 4.McMahon EJ, Campbell KL, Mudge DW et al. (2012) Achieving salt restriction in chronic kidney disease. Int J Nephrol 2012, 720429. [DOI] [PMC free article] [PubMed] [Google Scholar]
- 5.McLean RM (2014) Measuring population sodium intake: a review of methods. Nutrients 6, 4651–4662. [DOI] [PMC free article] [PubMed] [Google Scholar]
- 6.Mann SJ & Gerber LM (2010) Estimation of 24-hour sodium excretion from spot urine samples. J Clin Hypertens (Greenwich) 12, 174–180. [DOI] [PMC free article] [PubMed] [Google Scholar]
- 7.Rhee MY, Kim JH, Shin SJ et al. (2014) Estimation of 24-h urinary sodium excretion using spot urine samples. Nutrients 6, 2360–2375. [DOI] [PMC free article] [PubMed] [Google Scholar]
- 8.Tanaka T, Okamura T, Miura K et al. (2002) A simple method to estimate populational 24-h urinary sodium and potassium excretion using a casual urine specimen. J Hum Hypertens 16, 97–103. [DOI] [PubMed] [Google Scholar]
- 9.Kawasaki T, Ueno M, Uezono K et al. (1982) Average urinary excretion of sodium in 24 h can be estimated from a spot-urine specimen. Jpn Circ J 46, 948–953. [DOI] [PubMed] [Google Scholar]
- 10.Brown IJ, Dyer AR, Chan Q et al. (2013) Estimating 24-h urinary sodium excretion from casual urinary sodium concentrations in Western populations: the INTERSALT study. Am J Epidemiol 177, 1180–1192. [DOI] [PMC free article] [PubMed] [Google Scholar]
- 11.Charlton K, Ware LJ, Chidumwa G et al. (2019) Prediction of 24-hour sodium excretion from spot urine samples in South African adults: a comparison of four equations. J Hum Hypertens. Published online: 10 May 2019. doi: 10.1038/s41371-019-0210-2. [DOI] [PMC free article] [PubMed]
- 12.Kawamura M & Kawasaki T (2015) Clinical application of the second morning urine method for estimating salt intake in patients with hypertension. Clin Exp Hypertens 37, 89–96. [DOI] [PubMed] [Google Scholar]
- 13.Huang L, Crino M, Wu JH et al. (2016) Mean population salt intake estimated from 24-h urine samples and spot urine samples: a systematic review and meta-analysis. Int J Epidemiol 45, 239–250. [DOI] [PubMed] [Google Scholar]
- 14.Ji C, Sykes L, Paul C et al. (2012) Systematic review of studies comparing 24-h and spot urine collections for estimating population salt intake. Rev Panam Salud Publica 32, 307–315. [DOI] [PubMed] [Google Scholar]
- 15.Campbell NR, Legowski B & Legetic B (2011) Mobilising the Americas for dietary salt reduction. Lancet 377, 793–795. [DOI] [PubMed] [Google Scholar]
- 16.Mohammadifard N, Fahimi S, Khosravi A et al. (2012) Advocacy strategies and action plans for reducing salt intake in Iran. Arch Iran Med 15, 320–324. [PubMed] [Google Scholar]
- 17.Mohammadifard N, Khosravi AR, Esmaillzadeh A et al. (2016) Validation of simplified tools for assessment of sodium intake in Iranian population: rationale, design and initial findings. Arch Iran Med 19, 652–658. [PubMed] [Google Scholar]
- 18.Craig CL, Marshall AL, Sjostrom M et al. (2003) International physical activity questionnaire: 12-country reliability and validity. Med Sci Sports Exerc 35, 1381–1395. [DOI] [PubMed] [Google Scholar]
- 19.National Institutes of Health (2000) The Practical Guide: The Identification, Evaluation and Treatment of Overweight and Obesity in Adults. Bethesda, MD: NIH. [Google Scholar]
- 20.Liu WS, Chung YT, Yang CY et al. (2012) Serum creatinine determined by Jaffe, enzymatic method, and isotope dilution–liquid chromatography–mass spectrometry in patients under hemodialysis. J Clin Lab Anal 26, 206–214. [DOI] [PMC free article] [PubMed] [Google Scholar]
- 21.Wang CY, Cogswell ME, Loria CM et al. (2013) Urinary excretion of sodium, potassium, and chloride, but not iodine, varies by timing of collection in a 24-h calibration study. J Nutr 143, 1276–1282. [DOI] [PMC free article] [PubMed] [Google Scholar]
- 22.Cogswell ME, Wang CY, Chen TC et al. (2013) Validity of predictive equations for 24-h urinary sodium excretion in adults aged 18–39 y. Am J Clin Nutr 98, 1502–1513. [DOI] [PMC free article] [PubMed] [Google Scholar]
- 23.Mohammadifard N, Khaledifar A, Khosravi A et al. (2017) Dietary sodium and potassium intake and their association with blood pressure in a non-hypertensive Iranian adult population: Isfahan salt study. Nutr Diet 74, 275–282. [DOI] [PubMed] [Google Scholar]
- 24.Arain MA, Hultmann Ayala HV & Ansari MA (2012) Nonlinear system identification using neural network. In Emerging Trends and Applications in Information Communication Technologies: Proceedings of the Second International Multi Topic Conference, IMTIC 2012, Jamshoro, Pakistan, March 28–30, 2012, pp. 122–131 [Chowdhry BS, Shaikh FK, Hussain DMA et al., editors]. Berlin/Heidelberg: Springer.
- 25.Nelles O (2013) Nonlinear System Identification: From Classical Approaches to Neural Networks and Fuzzy Models. Berlin/Heidelberg: Springer Science & Business Media. [Google Scholar]
- 26.Marateb H & McGill KC (2009) Resolving superimposed MUAPs using particle swarm optimization. IEEE Trans Biomed Eng 56, 916–919. [DOI] [PMC free article] [PubMed] [Google Scholar]
- 27.Mohebian MR, Marateb HR, Mansourian M et al. (2017) A Hybrid Computer-aided-diagnosis System for Prediction of Breast Cancer Recurrence (HPBCR) using optimized ensemble learning. Comput Struct Biotechnol J 15, 75–85. [DOI] [PMC free article] [PubMed] [Google Scholar]
- 28.Arlot S & Celisse A (2010) A survey of cross-validation procedures for model selection. Stat Surv 4, 40–79. [Google Scholar]
- 29.Giavarina D (2015) Understanding Bland Altman analysis. Biochem Med (Zagreb) 25, 141–151. [DOI] [PMC free article] [PubMed] [Google Scholar]
- 30.Ma W, Yin X, Zhang R et al. (2017) Validation and assessment of three methods to estimate 24-h urinary sodium excretion from spot urine samples in high-risk elder patients of stroke from the rural areas of Shaanxi Province. Int J Environ Res Public Health 14, E1211. [DOI] [PMC free article] [PubMed] [Google Scholar]
- 31.Kawamura M, Ohmoto A, Hashimoto T et al. (2012) Second morning urine method is superior to the casual urine method for estimating daily salt intake in patients with hypertension. Hypertens Res 35, 611–616. [DOI] [PubMed] [Google Scholar]
- 32.Kawasaki T, Itoh K, Uezono K et al. (1993) A simple method for estimating 24 h urinary sodium and potassium excretion from second morning voiding urine specimen in adults. Clin Exp Pharmacol Physiol 20, 7–14. [DOI] [PubMed] [Google Scholar]
- 33.Toft U, Cerqueira C, Andreasen AH et al. (2014) Estimating salt intake in a Caucasian population: can spot urine substitute 24-hour urine samples? Eur J Prev Cardiol 21, 1300–1307. [DOI] [PubMed] [Google Scholar]
- 34.Ji C, Miller MA, Venezia A et al. (2014) Comparisons of spot vs 24-h urine samples for estimating population salt intake: validation study in two independent samples of adults in Britain and Italy. Nutr Metab Cardiovasc Dis 24, 140–147. [DOI] [PubMed] [Google Scholar]
- 35.Ogura M, Kimura A, Takane K et al. (2012) Estimation of salt intake from spot urine samples in patients with chronic kidney disease. BMC Nephrol 13, 36. [DOI] [PMC free article] [PubMed] [Google Scholar]
- 36.Mente A, O’Donnell MJ, Dagenais G et al. (2014) Validation and comparison of three formulae to estimate sodium and potassium excretion from a single morning fasting urine compared to 24-h measures in 11 countries. J Hypertens 32, 1005–1014; discussion 1015. [DOI] [PubMed] [Google Scholar]
- 37.Campbell N (2014) Validation and comparison of three formulae to estimate sodium and potassium excretion from a single-morning fasting urine compared to 24-h measures in 11 countries. J Hypertens 32, 2499–2500. [DOI] [PubMed] [Google Scholar]
- 38.Dyer AR, Martin GJ, Burton WN et al. (1998) Blood pressure and diurnal variation in sodium, potassium, and water excretion. J Hum Hypertens 12, 363–371. [DOI] [PubMed] [Google Scholar]
- 39.Watson RL & Langford HG (1970) Usefulness of overnight urines in population groups. Pilot studies of sodium, potassium, and calcium excretion. Am J Clin Nutr 23, 290–304. [DOI] [PubMed] [Google Scholar]
- 40.Subar AF, Midthune D, Tasevska N et al. (2013) Checking for completeness of 24-h urine collection using para-amino benzoic acid not necessary in the Observing Protein and Energy Nutrition study. Eur J Clin Nutr 67, 863–867. [DOI] [PubMed] [Google Scholar]
- 41.John KA, Cogswell ME, Campbell NR et al. (2016) Accuracy and usefulness of select methods for assessing complete collection of 24-hour urine: a systematic review. J Clin Hypertens (Greenwich) 18, 456–467. [DOI] [PMC free article] [PubMed] [Google Scholar]
Associated Data
This section collects any data citations, data availability statements, or supplementary materials included in this article.
Supplementary Materials
For supplementary material accompanying this paper visit https://doi.org/10.1017/S136898001900257X.
click here to view supplementary material